

⚡ Executive Summary for Bioprocess Directors, VP QA/QC, MSAT Leads & CMC Teams
- The Static Validation Fallacy: Traditional 3-batch Process Performance Qualification (PPQ) assumes bioprocesses operate within static mechanical setpoints. However, transitioning from a 5 L benchtop reactor to a 15,000 L commercial fermenter introduces profound hydrodynamic gradients (tip speed surging $>140\%$, mixing lag expanding 6-fold, hydrostatic head adding $>0.54\text{ bar}$). These physical shifts trigger critical quality attribute (CQA) drift—such as altered N-linked glycosylation and aggregate formation—rendering static validation dossiers vulnerable to regulatory rejection.
- The Data Integrity Minefield (21 CFR Part 11 & ALCOA+): Over 60% of FDA Form 483 observations and warning letters issued to biomanufacturers cite data integrity failures. Disconnected offline bio-analyzers, untracked spreadsheet calculations, missing audit trails, and manual paper tally sheets violate ALCOA+ standards (Attributable, Legible, Contemporaneous, Original, Accurate), freezing multi-million-dollar batch releases.
- The 21-Day QC Release Bottleneck vs. RTRT: Legacy batch release requires 14–21 days of offline compendial sterility tests (USP <71>), endotoxin LAL assays (USP <85>), and bioburden incubation. Integrating Process Analytical Technology (PAT)—inline Raman spectroscopy, off-gas mass spectrometry, and soft sensors—enables Real-Time Release Testing (RTRT) under ICH Q8/Q13, collapsing release cycle times from weeks to hours and unlocking over $12M+ in tied-up working capital.
- Revised EU GMP Annex 1 & Sterility Assurance ($F_0$ & LRV): The revised EU GMP Annex 1 mandate enforces a holistic Contamination Control Strategy (CCS). Thermal sterilization cycles must demonstrate first-principles lethality ($F_0 \ge 15\text{ min}$) to guarantee Sterility Assurance Levels ($\text{SAL} \le 10^{-6}$), while downstream viral clearance must prove cumulative Log Reduction Values ($\text{LRV} \ge 12\text{-}16$) across orthogonal operations.
- Statistical Process Control & Stage 3 CPV: Under FDA Process Validation guidance, validation never ends. Maintaining a state of statistical control requires continuous calculation of process capability indices ($C_{pk} \ge 1.33$). Operating at $C_{pk} < 1.0$ guarantees recurring out-of-specification (OOS) investigations and regulatory scrutiny.
In the global biopharmaceutical industry—where a single commercial batch of monoclonal antibodies, recombinant vaccines, or viral vectors can represent an asset value between $1,000,000 and $5,000,000—compliance with Current Good Manufacturing Practice (cGMP) is not an administrative formality. It is the fundamental physical and mathematical contract between the bioprocess engineer and the patient.
Yet, biomanufacturing sits at a treacherous intersection: while upstream molecular biology and downstream purification have advanced into continuous perfusion and multi-column chromatography, regulatory compliance strategies often remain trapped in 1990s paradigms. Process engineers optimize fluid dynamics and titers, while quality assurance teams enforce static historical filing boundaries. When physical transport phenomena inevitably shift during scale-up, these two worlds collide.
The result is an epidemic of FDA Form 483 observations, complete response letters (CRLs), scrapped production runs, and multi-month facility shutdowns. Below is an engineering and quality dissection of the core regulatory pillars governing bioprocess operations—grounded in governing transport equations, statistical process control, and practical compliance reality.
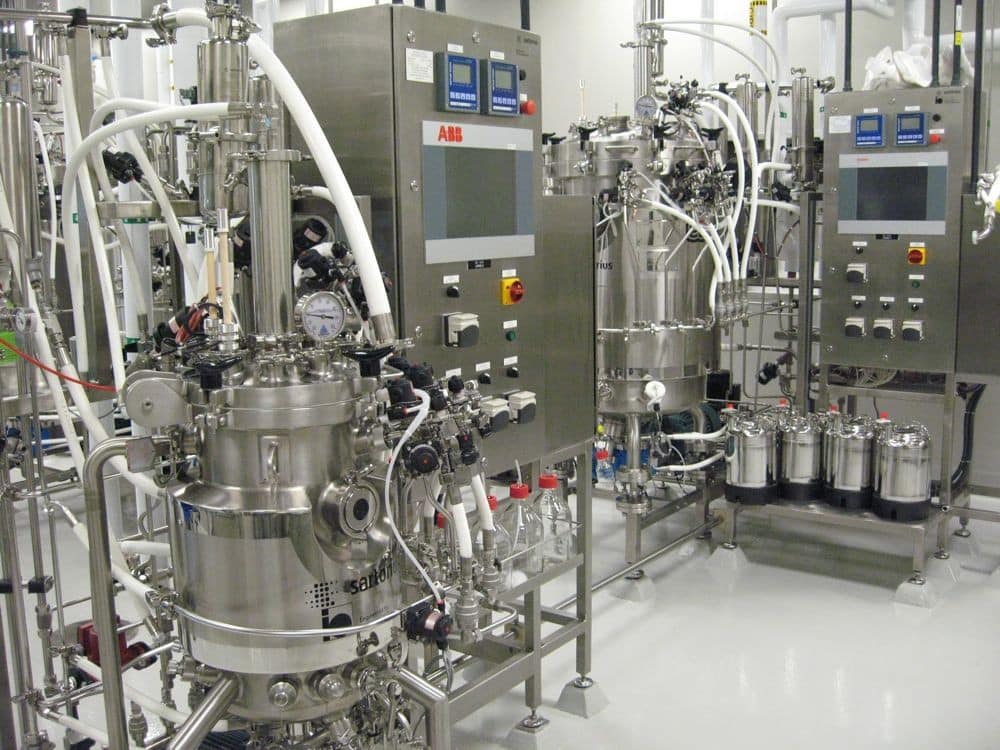
1. The 3-Stage Process Validation Lifecycle vs. The Scale-Up Reality
For decades, the standard pharmaceutical paradigm for validation was the “Rule of Three”: manufacture three consecutive commercial-scale batches, test end-product samples against release specifications, file the paperwork, and freeze the process indefinitely. The 2011 FDA Process Validation Guidance and subsequent ICH Q8–Q11 harmonized guidelines dismantled this static approach, replacing it with a continuous 3-stage lifecycle:
- Stage 1: Process Design: Defining the commercial manufacturing process based on knowledge gained through development, identifying Critical Quality Attributes (CQAs), and establishing Critical Process Parameters (CPPs) using Design of Experiments (DoE) and Quality by Design (QbD).
- Stage 2: Process Qualification (PPQ): Evaluating the process design to determine if the process is capable of reproducible commercial manufacturing, combining Facility/Equipment Qualification (DQ/IQ/OQ/PQ) and Process Performance Qualification.
- Stage 3: Continued Process Verification (CPV): Ongoing assurance during routine production that the process remains in a state of statistical control.

The engineering dilemma occurs during the transition from Stage 1 to Stage 2. At benchtop (1 L to 5 L), fluid mixing is near-instantaneous ($\theta_{95} < 10\text{ s}$), hydrostatic pressure is negligible ($\approx 0.02\text{ bar}$), and oxygen mass transfer ($k_L a$) is easily achieved without lethal tip speeds ($v_{\text{tip}} \approx 1.2\text{ m/s}$).
When transferring this approved Design Space into a 15,000 L commercial stirred tank under constant power-to-volume scaling ($P/V = \text{const}$):
- Impeller tip speed jumps by +143% ($v_{\text{tip}} \approx 2.92\text{ m/s}$), creating localized shear zones where turbulent kinetic energy dissipation ($\epsilon_{\max} \propto N^3 D_i^2$) shears mammalian CHO cells, alters cellular metabolism, and increases host-cell protein (HCP) leakage.
- Blending lag balloons to nearly 60 seconds ($\theta_{95} \propto V^{2/9}$). When base or concentrated glucose is titrated from the headspace, cells endure sustained pH spikes ($>8.5$) or osmotic stress before homogenization.
- Hydrostatic head adds $>54\text{ kPa}$ ($0.54\text{ bar}$) at the bottom sparger. By Henry’s Law ($C^* = P_{\text{gas}} / H$), carbon dioxide stripping is severely suppressed, creating hypercapnia ($pCO_2 > 140\text{ mmHg}$).
Under hypercapnic stress and shear gradients, post-translational modification kinetics shift: cell lines alter terminal sialylation, core fucosylation, and galactosylation profiles. Because glycosylation dictates in vivo serum half-life and antibody-dependent cellular cytotoxicity (ADCC), the product’s Critical Quality Attributes have drifted—even though every single instrument operated within its validated CPP tolerance!
2. The Governing Mathematical Mechanics of cGMP Compliance
Modern cGMP regulators no longer accept qualitative assertions of compliance. Verification requires rigorous mathematical formulations across process capability, thermal sterilization, viral clearance, and tracer residence distributions.
Process Capability Indices ($C_p$ and $C_{pk}$)
In Stage 3 Continued Process Verification (CPV), regulators evaluate whether a bioprocess operates with sufficient statistical margin between historical process variability and Upper/Lower Specification Limits (USL/LSL):
Governing Process Capability Formulations:
$$C_p = \frac{\text{USL} - \text{LSL}}{6\sigma}$$
$$C_{pk} = \min\left(\frac{\text{USL} - \mu}{3\sigma}, \frac{\mu - \text{LSL}}{3\sigma}\right)$$
Where $\mu$ is the process mean, $\sigma$ is the within-batch or batch-to-batch standard deviation, and $\text{USL}/\text{LSL}$ are product specification limits (e.g., aggregate content $\le 2.0\%$, monomer purity $\ge 95.0\%$, osmolality $300 \pm 30\text{ mOsm/kg}$).
In commercial biomanufacturing:
- $C_{pk} \ge 1.33$ (4-Sigma): The regulatory benchmark for an established, validated commercial process. Expected defect rate is under $64\text{ parts per million (PPM)}$.
- $1.0 \le C_{pk} < 1.33$ (Marginal): Requires heightened monitoring and corrective action under Stage 3 CPV trending.
- $C_{pk} < 1.0$ (Incapable): The process width exceeds specification limits. Out-of-specification (OOS) batches are statistically guaranteed, triggering continuous deviation reports and FDA scrutiny.
Thermal Sterilization Lethality ($F_0$) & Sterility Assurance Level ($\text{SAL}$)
Under the revised EU GMP Annex 1 and USP <1211>, thermal sterilization of equipment, media, and buffer vessels (SIP/autoclaving) must be quantified using the physical temperature-time integral rather than arbitrary hold times:
$$F_0 = \int_0^t 10^{\frac{T(\tau) - 121.1^\circ\text{C}}{z}} d\tau = D_{121} \cdot \left(\log_{10} N_0 - \log_{10} N_{\text{sterile}}\right)$$
Where $z$ is the temperature sensitivity coefficient ($10.0^\circ\text{C}$ for heat-resistant Geobacillus stearothermophilus spores), $D_{121}$ is the decimal reduction time at standard $121.1^\circ\text{C}$ ($D_{121} \approx 1.5\text{-}2.0\text{ min}$), $N_0$ is initial pre-sterilization bioburden, and $N_{\text{sterile}}$ is the required Sterility Assurance Level ($\text{SAL} \le 10^{-6}$).
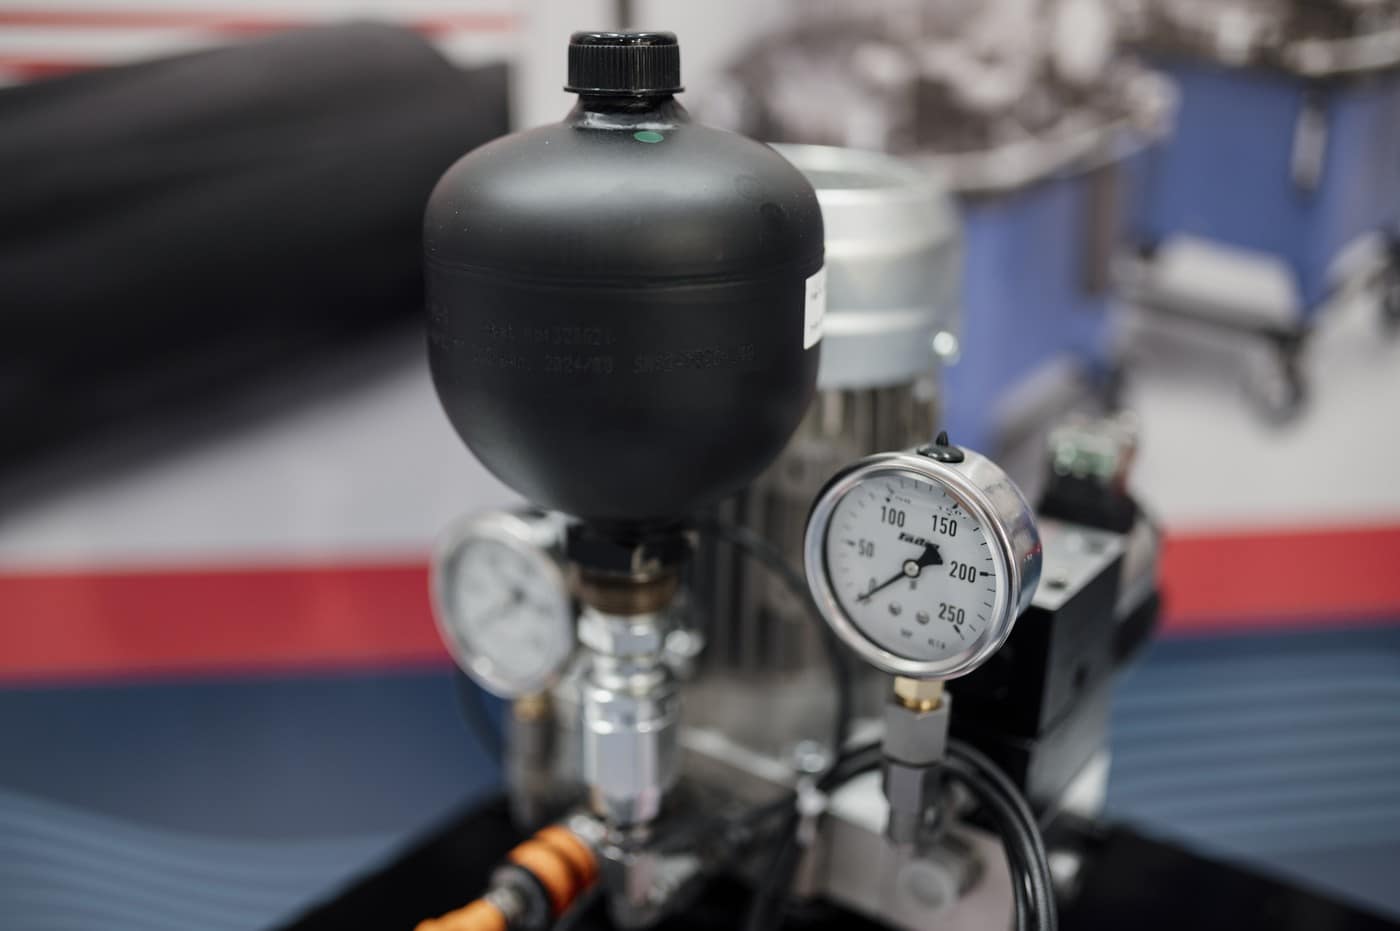
If initial bioburden is underestimated due to poor plating or manual counting errors (e.g. true bioburden is $N_0 = 10^5\text{ CFU}$ while the lab reported $N_0 = 10^2\text{ CFU}$), an engineer targeting an $F_0 = 12\text{ min}$ cycle will under-process the vessel. The residual survival probability balloons from $10^{-6}$ to $10^{-3}$, causing catastrophic cleanroom contamination.
Downstream Viral Clearance & Log Reduction Value (LRV)
Under ICH Q5A(R2) (Viral Safety Evaluation of Biotechnology Products Derived from Cell Lines of Human or Animal Origin), commercial downstream purification must demonstrate complete removal of endogenous and adventitious viral particles (e.g., retroviruses, parvoviruses). Clearance across each downstream unit operation is quantified by the Log Reduction Value:
Governing Viral Clearance Equation:
$$\text{LRV} = \log_{10}\left(\frac{C_{\text{feed}} \cdot V_{\text{feed}}}{C_{\text{filtrate}} \cdot V_{\text{filtrate}}}\right) = \log_{10}(T_{\text{input}}) - \log_{10}(T_{\text{output}})$$
Where $C$ is infectious viral titer (e.g., $\text{TCID}_{50}/\text{mL}$ or qPCR genome copies) and $V$ is process pool volume.
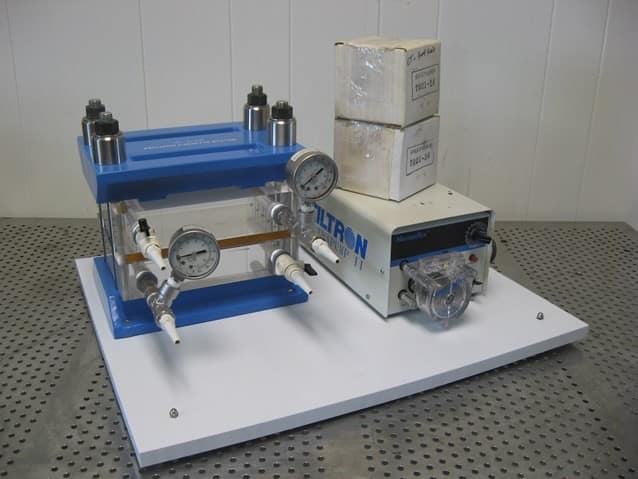
Regulatory approval requires demonstrating orthogonal clearance mechanisms—such that no single failure mode compromises safety. A standard monoclonal antibody downstream platform includes:
- Low-pH Hold ($\text{pH } 3.5\text{-}3.7$ for $60\text{-}90\text{ min}$): $\text{LRV} \ge 4.5\text{-}5.5$ for enveloped retroviruses.
- Anion-Exchange (AEX) Chromatography in flow-through mode: $\text{LRV} \ge 4.0\text{-}5.0$.
- $20\text{ nm}$ Viral Filtration (Nanofiltration): $\text{LRV} \ge 4.0\text{-}6.0$ for non-enveloped parvoviruses (e.g., Minute Virus of Mice, MVM).
Total cumulative clearance must exceed $\ge 12\text{-}16\text{ logs}$, ensuring that the theoretical calculated residual virus risk is less than $1 \text{ particle per } 10^6\text{ doses}$.
3. The 21 CFR Part 11 Minefield & ALCOA+ Data Integrity Principles
Of all regulatory vulnerability vectors, none generates more regulatory warning letters than data governance under 21 CFR Part 11 and EU GMP Annex 11. Modern biomanufacturing plants generate gigabytes of time-series data daily: DO/pH trends, off-gas concentrations, cell counts, chromatograms, and CIP rinse conductivity.
Inspectors evaluate these systems against the updated ALCOA+ data integrity framework:
The ALCOA+ Data Integrity Standard:
- Attributable: Every action, log entry, and parameter change is traceable to an authenticated individual with unique credentials. Shared operator logins (“Operator1”, “Admin”) are instantaneous 483 citations.
- Legible & Contemporaneous: Data must be recorded at the exact moment of execution. Retrospective recording (“signing the batch record at the end of the shift”) constitutes falsification.
- Original & Accurate: The raw primary recording—not a transcribed summary—must be preserved without unapproved modifications.
- Complete, Consistent, Enduring & Available: All metadata, audit trails, abort sequences, and re-tested runs must be permanently stored and accessible for inspection throughout the product’s shelf-life.

The classic failure mode is the “Excel Calculation Sheet”: an engineer builds a spreadsheet to calculate feed rates or dilution series. Because Excel cells lack secure electronic signatures, cryptographic tamper-proofing, and immutable audit logs, using unvalidated spreadsheets for batch execution violates 21 CFR Part 11.200 and invites regulatory shutdown.
4. Real-World Engineering Case Study: Legacy Batch vs. PAT Continuous Facility
To illustrate the operational and financial impact of modern cGMP engineering, consider a comparative trial between two commercial facilities producing the same recombinant therapeutic mAb at 2,500 L scale:
- Facility A (Legacy 1990s Batch Paradigm): Static 3-batch PPQ validation; manual offline sampling every 12 hours; 21-day quarantine waiting for compendial sterility, endotoxin, and HPLC release assays; paper batch records.
- Facility B (Modern PAT-Enabled QbD / RTRT Facility): Continuous Process Verification (CPV); inline Raman spectroscopy for glucose/lactate; continuous off-gas mass spectrometry; automated digital colony verification (PetriCount); Real-Time Release Testing (RTRT) under ICH Q8/Q13.
De-Risk Your cGMP Bioprocess & Validation with BioFlo
Calculate equivalent sterilization times and SAL log-reductions under Annex 1.
🧪 TFF Filtration & Diafiltration Simulator →
Model transmembrane pressure, gel polarization & concentration factors.
📐 Bioreactor Scale-Up Engine →
Maintain geometric, kinematic, and dynamic similarity across scale.
🧫 BioFlo PetriCount AI →
Automated 21 CFR Part 11 colony counting and digital bioburden archiving.
Preparing a regulatory dossier, Stage 2 PPQ campaign, or continuous manufacturing filing?