

⚡ Executive Summary for Bioprocess Directors, MSAT Leads & QC Specialists
- The Ghost-Cell Blindness Gap: Upstream fermentation engineers routinely rely on spectrophotometric optical density ($OD_{600}$) or uncorrected total cell density (TCD) as primary harvest triggers. However, spectrophotometers measure total light scattering—registering dead cells, lysed membrane fragments, and cellular ghosts identically to viable biomass. While upstream dashboards boast $OD_{600} = 85$, actual viable cell density ($X_v$) may have crashed from $92\%$ to below $60\%$.
- The Downstream 70% Flux Penalty: Inactive and apoptotic cells cease recombinant protein secretion ($q_P \rightarrow 0$) and dump viscous genomic DNA (gDNA), host-cell proteins (HCP), and colloidal lipids into the broth. In primary recovery and Tangential Flow Filtration (TFF), this compressible debris inflates specific cake resistance ($R_{\text{cake}} \propto M_{\text{debris}} \cdot \Delta\text{TMP}^s$), collapsing permeate flux by up to 70% and blinding $0.22\ \mu\text{m}$ sterilizing filters within minutes.
- The Sterility Assurance Imperative ($F_0$ & Bioburden): Downstream sterile release (USP <61>/<71>, Ph. Eur. 2.6.1) and thermal sterilization design ($F_0$ lethality) depend strictly on viable Colony-Forming Units (CFU). Underestimating initial bioburden due to poor plating or miscounting causes catastrophic under-processing, breaking regulatory sterility assurance ($\text{SAL} \le 10^{-6}$).
- The Plating & Dilution Bottleneck: Manual agar plate counting is notoriously subjective, agonizingly slow, and prone to $\pm 15\%\text{-}30\%$ inter-operator counting drift. Crucially, when colony densities exceed 250 CFU per dish, spatial crowding causes severe Poisson overlap, systematically undercounting true bioburden.
- Edge-AI Automation with PetriCount: BioFlo PetriCount introduces on-device computer vision (YOLOv8 + morphological watershed + Poisson-Gaussian crowding correction) to isolate colonies down to $0.2\text{ mm}$, classify size distributions (pinpoint to large), and deliver audit-proof, 21 CFR Part 11-compliant verification in under 3 seconds.
Across therapeutic monoclonal antibodies, viral vectors (AAV, lentivirus), precision recombinant enzymes, and food-grade microbial biomass, process development teams celebrate high-density fermentations. Stirred-tank bioreactors pushing optical densities past $OD_{600} > 100$ or mammalian cultures reaching $>40 \times 10^6\text{ cells/mL}$ are heralded as upstream masterstrokes. Yet when that broth is transferred to the downstream purification suite, an alarming paradox emerges: filtration skids stall under exponential transmembrane pressure spikes, depth filter beds blind prematurely, and Protein A affinity resin columns bleed binding capacity.
The culprit is the Ghost-Cell Fallacy: the dangerous assumption that total biomass correlates directly with active, productive biology. Turbidimetric assays cannot differentiate between an actively respiring cell factory and an apoptotic cell ghost spilling intracellular viscera. Without rigorous upstream active cell quantification and strict downstream microbiological verification, biomanufacturers operate with critical blindspots that cost hundreds of thousands of dollars per campaign.
In this engineering analysis, we dissect the mathematical transport phenomena governing ghost-cell accumulation, demonstrate why downstream purification economics hinge entirely on active viable cell counts, and explore how automated computer vision tools like BioFlo PetriCount bridge the analytical gap between harvest and final fill-finish release.
1. The Upstream Ghost-Cell Fallacy: Why $OD_{600}$ and Turbidity Are Lying to You
Spectrophotometric optical density measured at 600 nm ($OD_{600}$) is the universal workhorse of microbiological monitoring. It is fast, non-destructive, and easily automated via flow-through cuvettes. However, from a physical optics standpoint, $OD_{600}$ does not measure biological vitality—it measures Rayleigh-Gans-Debye turbidity caused by refractive index mismatch between particulate matter and the liquid media.
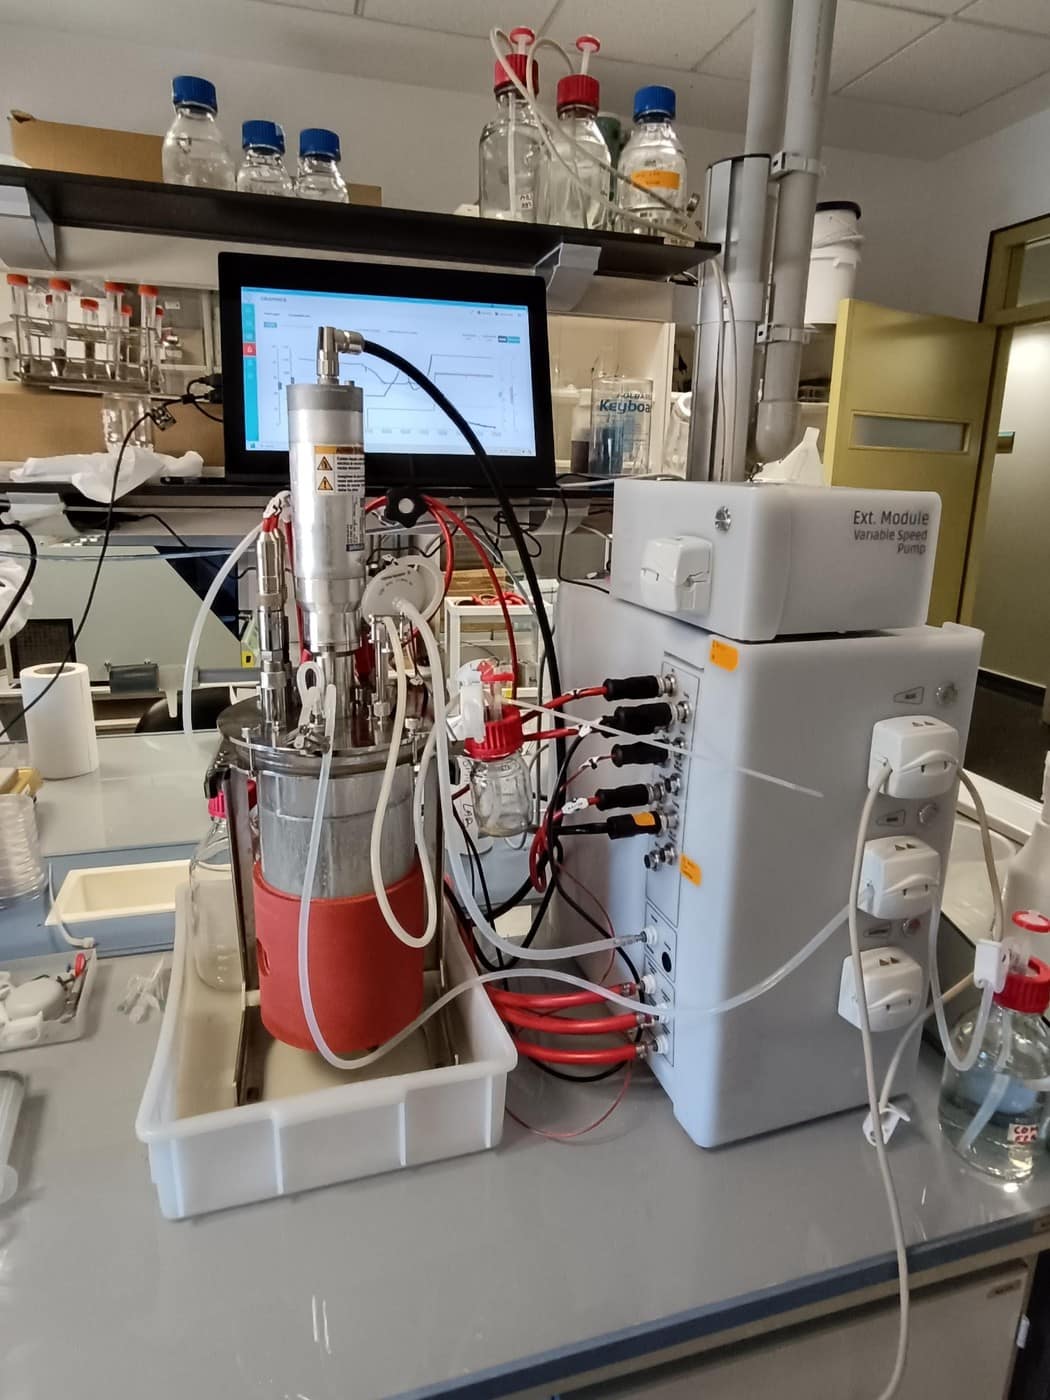
When a microbial culture (e.g. E. coli, Pichia pastoris) or mammalian culture (CHO, HEK293) shifts from exponential growth into stationary and death phases, the total broth biomass decouples into three distinct populations:
Governing Biomass & Lysis Population Kinetics:
$$\frac{dX_v}{dt} = (\mu - k_d) X_v$$
$$\frac{dX_d}{dt} = k_d X_v - k_{\text{lysis}} X_d$$
$$\frac{d[\text{HCP}]}{dt} = q_{\text{hcp}} X_v + k_{\text{lysis}} X_d \cdot \beta_{\text{intracellular}}$$
Where $X_v$ is viable cell density (cells/mL or g DCW/L), $X_d$ is intact non-viable ghost cells, $\mu$ is specific growth rate ($\text{h}^{-1}$), $k_d$ is specific death rate ($\text{h}^{-1}$), $k_{\text{lysis}}$ is the cell wall lysis constant ($\text{h}^{-1}$), and $\beta_{\text{intracellular}}$ is the intracellular host-cell protein release coefficient.
Total optical turbidity is the linear superposition of scattering cross-sections:
$$OD_{600}(t) = \kappa_v X_v(t) + \kappa_d X_d(t) + \kappa_{\text{debris}} M_{\text{debris}}(t)$$
In late-stage fed-batch operations, nutrient depletion (carbon starvation, glutamine limitation) and accumulated metabolic toxins (ammonium, lactate, organic acids) elevate $k_d$ above $\mu$. As cells die, they form permeabilized “ghost cells”—intact shells lacking intact metabolic gradients. Because ghost cells and large debris fragments scatter $600\text{ nm}$ photons almost as effectively as living cells ($\kappa_d \approx 0.85\text{-}0.95 \kappa_v$), the operator’s spectrophotometer displays steady or climbing turbidity, masking the collapse in culture viability.
The Decoupling of Product Titer: Recombinant protein or secondary metabolite synthesis depends strictly on active, respiring biomass: $P(t) = \int_0^t q_P(\tau) X_v(\tau) d\tau$. Waiting to harvest based on peak $OD_{600}$ rather than peak $X_v$ does not yield additional target product. Instead, it allows intracellular proteases to cleave the recombinant protein while dramatically worsening downstream impurity burdens.
2. The Downstream DSP Catastrophe: How Ghost Cells and Debris Choke Purification
When a harvest with poor viability ($<70\%$) is pumped into downstream clarification, the financial consequences are immediate. Downstream purification accounts for 65% to 80% of total biomanufacturing OpEx. Ghost cells and cellular lysis products alter fluid rheology and destroy filtration membrane permeability.
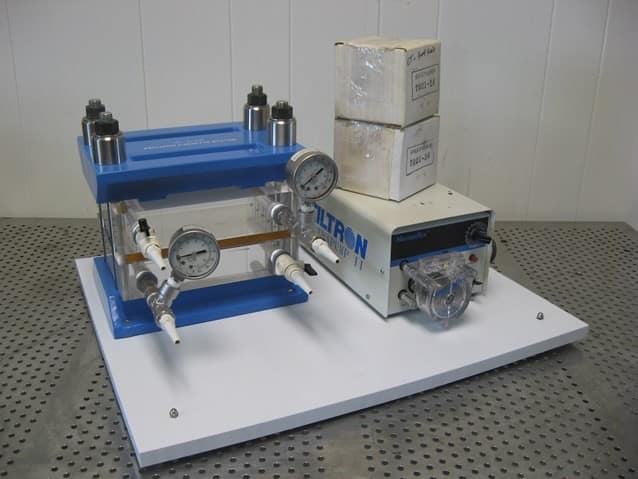
The Physics of Tangential Flow Filtration (TFF) Cake Fouling
During cell harvest, microfiltration, or ultrafiltration, permeate flux $J$ ($\text{L}\cdot\text{m}^{-2}\cdot\text{h}^{-1}$) is governed by the Darcy resistance-in-series model:
$$J = \frac{\Delta\text{TMP}}{\mu_b \cdot \left(R_m + R_{\text{cake}}(t) + R_{\text{pore}}\right)}$$
Where $\Delta\text{TMP}$ is the transmembrane pressure, $\mu_b$ is filtrate dynamic viscosity, $R_m$ is the clean membrane hydraulic resistance, $R_{\text{pore}}$ is internal pore-adsorption fouling resistance, and $R_{\text{cake}}$ is the external surface cake resistance. For a polydisperse suspension containing cell debris and uncoiled genomic DNA, the cake layer is highly compressible:
Compressible Cake Resistance Formulation:
$$R_{\text{cake}}(t) = \alpha_0 \cdot (\Delta\text{TMP})^s \cdot \left(\frac{M_{\text{debris}}(t)}{A_{\text{filter}}}\right)$$
Here, $\alpha_0$ is specific cake resistance, $s$ is the cake compressibility index ($0.65 < s < 0.95$ for deformable biological debris), and $M_{\text{debris}}/A_{\text{filter}}$ is the accumulated mass of debris per unit membrane area.
When an operator harvests at $92\%$ viability, intact cells are retained by tangential shear flow and roll across the membrane surface with minimal compaction ($s \approx 0.1\text{-}0.2$). But when harvesting at $60\%$ viability, lysed subcellular fragments ($0.1\text{-}1.0\ \mu\text{m}$) and viscous polyanionic DNA strands pack into the pores, forming a dense, gelled skin. Because $s \approx 0.85$, increasing feed pump pressure or $\Delta\text{TMP}$ simply squashes the cake layer tighter, dropping permeate flux rather than increasing throughput.
The Three Downstream Choke Points Caused by Inactive Cells:
- Sterilizing-Grade ($0.22\ \mu\text{m}$) Filter Blinding: Sub-micron lipid micelles and colloidal fragments pass straight through coarse depth filters but rapidly blind downstream polyethersulfone (PES) sterilizing membranes. This forces mid-run emergency filter swap-outs, risking cleanroom contamination deviations.
- Protein A Resin Poisoning (\$14,000/L): For mAb therapeutics, recombinant Protein A chromatography is the most capital-intensive consumable. Lysed cell debris contains active intracellular proteases (cleaving antibody Fc domains), host-cell DNA (fouling resin pores), and high HCP titers. This drops dynamic binding capacity (DBC) from$55\text{ mg/mL}$to under$30\text{ mg/mL}$and cuts resin lifespan from 100 cycles to fewer than 40.
- Viscosity-Induced Buffer Gridlock: Uncoiled gDNA releases into the broth at concentrations up to$500\text{-}1,200\text{ mg/L}$. Broth viscosity ($\mu_b$) surges two- to fivefold, choking peristaltic pump heads, elevating diafiltration backpressures, and requiring massive benzonase endonuclease enzymatic treatments that add thousands of dollars per batch.
3. The Downstream Verification Imperative: Bioburden,$F_0$Sterility Release, and Log Reduction
While upstream teams must monitor viability to protect yield and membrane flux, downstream quality control teams face an absolute regulatory mandate: microbiological bioburden verification. Regulatory compendia—including USP (Microbial Examination of Nonsterile Products), USP (Sterility Tests), and Ph. Eur. 2.6.1—require verifiable quantitative counting of Colony-Forming Units (CFU).
Thermal Death Kinetics & Thermal Sterilization ($F_0$)
In sterile fill-finish operations and thermal sterilization cycles (SIP autoclaving of formulation tanks, media prep, and buffer hold vessels), thermal microbial inactivation follows first-order logarithmic death kinetics: $$\frac{dN}{dt} = -k_T(T) \cdot N \implies \log_{10}\left(\frac{N(t)}{N_0}\right) = -\frac{t}{D_T}$$ Where$D_T$is the decimal reduction time (the minutes at temperature$T$required to destroy$90\%$of viable organisms). The cumulative equivalent sterilization time at standard$121.1^\circ\text{C}$is quantified by the $F_0$Lethality Equation:4. The Colony Counting Crisis & Mathematical Crowd Overlap Correction
Despite the digital transformation of modern biopharma, microbial bioburden verification and viable cell counts are still executed using 140-year-old Petri dish agar plating methods. In QC testing labs worldwide, technicians manually count colonies using mechanical clickers and marker pens on the back of plastic dishes. This manual practice suffers from severe structural vulnerabilities:- Operator Fatigue & Counting Drift: Counting dishes with 150–300 colonies induces severe optical fatigue. Inter-operator counts on identical dishes routinely diverge by $\pm 15\%$to$32\%$.
- Dilution Error Compounding: Because agar plating requires serial 10-fold dilutions ($10^{-1}$to$10^{-6}$), a minor pipetting inaccuracy ($\pm 5\%$) or counting error on a concentrated plate propagates exponentially into the final CFU/mL calculation.
- Pinpoint Colony Invisibility: Slow-growing, fastidious contaminants or micro-colonies ($< 0.5\text{ mm}$) are easily obscured by agar meniscus reflections, dish scratches, or condensation droplets.
The Mathematical Physics of Colony Crowding & Overlap
According to USP and standard microbiology standards, agar plates are considered statistically reliable only within the range of 30 to 300 CFU per plate (or 25 to 250 CFU). The upper limit exists because colonies cease to be independent points when density increases—they physically collide and coalesce. Assume an agar plate with surface area$A_{\text{plate}}$(for a standard$90\text{ mm}$dish,$A_{\text{plate}} = \pi \cdot (45\text{ mm})^2 \approx 6,362\text{ mm}^2$) upon which$N_{\text{true}}$viable cells land randomly according to a spatial Poisson point process. Each grown colony occupies an effective projected circular area$a_{\text{col}} = \pi r_{\text{col}}^2$. The probability that any given point on the plate surface is covered by at least one colony is (P(\text{covered}) = 1-\exp\left(-\frac{N_{\text{true}} \cdot a_{\text{col}}}{A_{\text{plate}}}\right)). Consequently, the observed count of discrete visible colonies$N_{\text{obs}}$saturates and curves downward away from the true count:5. BioFlo PetriCount: Edge-AI Computer Vision for Active Cell & Bioburden Verification
To resolve this analytical crisis, BioFlo engineered PetriCount—an Edge-AI computer vision system that runs 100% offline on-device in mobile browsers, lab workstations, and Android devices without requiring continuous cloud connectivity or expensive benchtop imaging skids.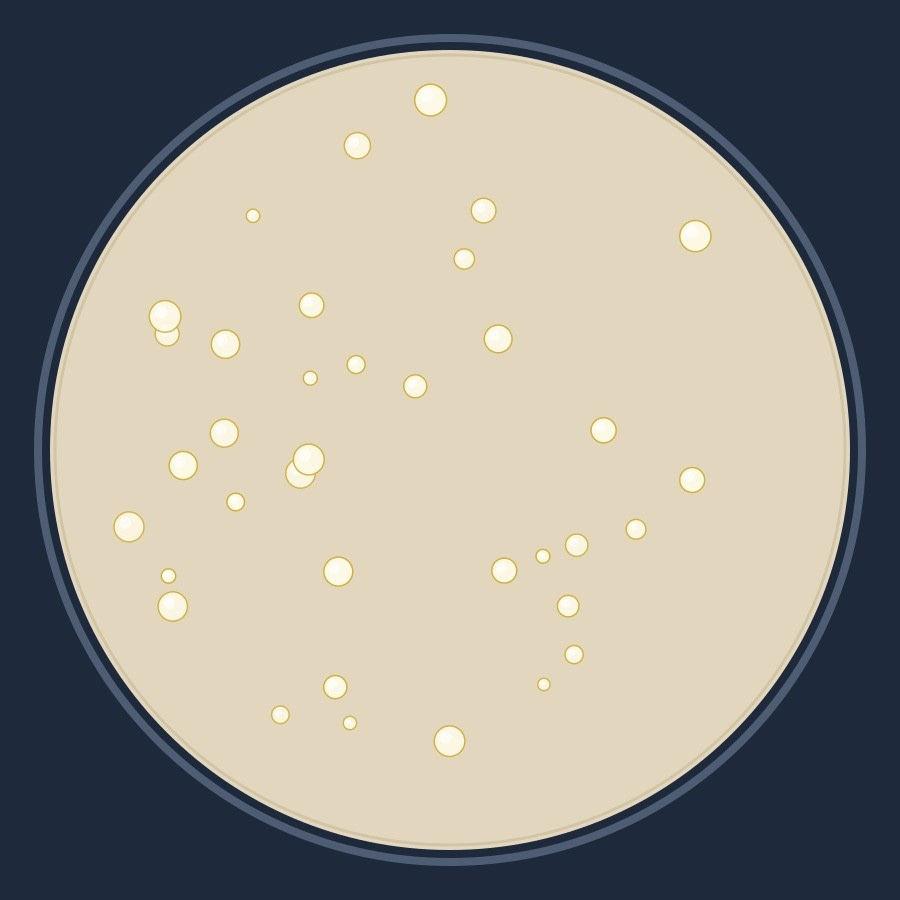
How PetriCount Works Under the Hood:
- Automated Rim Detection & Spatial Calibration: PetriCount utilizes a circular Hough transform and adaptive contrast segmentation to identify the inner rim of the Petri dish ($90\text{ mm}$standard). It computes the exact millimeter-per-pixel spatial scale ($\mu\text{m/px}$), allowing precise physical sizing across any camera resolution or tilt angle.
- Deep Learning Object Detection (YOLOv8 + ONNX): Rather than relying solely on naive RGB thresholding that misinterprets agar bubbles and scratches as cells, PetriCount feeds pre-processed tiles through an optimized convolutional neural network (CNN/YOLOv8 backbone via ONNX Runtime). The network outputs bounding boxes, centroid coordinates$(c_x, c_y)$, and confidence scores for each individual colony.
- Morphological Watershed & De-Clustering: For crowded plates where colony edges merge, PetriCount applies a distance-transform guided watershed segmentation algorithm. It locates local Euclidean distance maxima within overlapping blobs, placing dividing lines along saddle points to resolve twin and triplet colonies.
- Automated Morphometric Profiling: PetriCount automatically classifies every detected colony into standardized size bins:
- Pinpoint:$< 1.0\text{ mm}$(slow growers, fastidious bacteria)
- Small:$1.0\text{-}2.5\text{ mm}$
- Medium:$2.5\text{-}4.5\text{ mm}$
- Large:$> 4.5\text{ mm}$(fast-growing spreaders, molds)
- 21 CFR Part 11 Electronic Compliance: Every plate analysis generates an immutable digital record: timestamped original image, color-coded segmentation overlay, bounding box inventory, dilution-corrected CFU/mL in scientific notation, and operator audit metadata.
BioFlo PetriCount for Android
com.bioflo.petricount Google Play Closed Beta6. Real-World Engineering Case Study: 2,000 L Biomanufacturing Run
To demonstrate the commercial and operational impact of active cell counting and downstream verification, consider a comparative trial conducted on an industrial$2,000\text{ L}$fed-batch recombinant protein manufacturing campaign:- Run A (Traditional$OD_{600}$Blindness): Harvest initiated at hour 114 based on target optical density ($OD_{600} = 88$). Manual trypan blue checks reported viability at$72\%$, but post-mortem plating revealed true culture viability had fallen to $59\%$ due to extensive lysis.
- Run B (Active Cell Quantification & PetriCount Verification): Culture monitored with real-time specific productivity metrics and active viable cell tracking. Harvest triggered at hour 82 when active viable cell density peaked ($X_v = 36.2 \times 10^6\text{ cells/mL}$, viability$92\%$), with immediate PetriCount bioburden verification.
The financial reality is clear: Run A produced slightly less intact target protein due to protease cleavage, yet burned through three additional sterile filter capsules, severely fouled the TFF skid, and slashed the operating lifespan of the chromatography resin column in half. By prioritizing active viable biomass over misleading optical density and securing downstream bioburden with computer vision, Run B achieved lower manufacturing costs and guaranteed compliance.
Accelerate Your Active Cell & Downstream Workflows with BioFlo
Eliminate operator counting variability, simulate downstream filtration fouling, and calculate precise thermal sterilization lethality using BioFlo’s production-grade engineering tools:
📱 PetriCount Android App →
Install com.bioflo.petricount on Google Play (Testing Beta).
🧫 BioFlo PetriCount Web Suite →
Browser-based colony counting, morphometry & CFU quantification.
📊 OD to Cell Density Converter →
Convert spectrophotometric OD600 to dry cell weight and viable density.
🧪 TFF Filtration Simulator →
Model transmembrane pressure, gel polarization & cake resistance.
🌡️ $F_0$ Sterilization Lethality Engine →
Calculate equivalent sterilization time and bioburden log reduction.
Looking to audit your downstream filtration train or deploy automated AI vision in your cleanroom?