

⚡ Executive Summary for Bioprocess Directors, VP Automation, Principal MSAT Leads & OT Architects
- The 1,200 ms Cloud Latency Trap: Centralized cloud architectures introduce round-trip network latencies ($\tau_{\text{cloud}} \approx 250\text{-}2,500\text{ ms}$) and stochastic packet jitter. During exponential cell growth or high-density microbial fermentation, an oxygen transfer emergency or foam front propagates in under $2\text{ seconds}$. Detuning control loop gain $K_c$ to accommodate cloud latency destroys phase margin ($\text{PM} < 30^\circ$), destabilizing dissolved oxygen cascade control.
- The Spectroscopic Telemetry Choke: Modern Process Analytical Technology (PAT)—inline Raman spectroscopy, dielectric permittivity probes, and magnetic sector off-gas mass spectrometers—generates raw spectral matrices at rates exceeding $50\text{ MB/hour}$ per vessel. Pushing uncompressed spectra across WAN links saturates industrial firewalls and creates prohibitive operational egress costs.
- The ISA-95 / Purdue Model Air-Gap Conflict: Industrial cybersecurity mandates strict segmentation between Level 1/2 control networks (PLCs, IO-Link sensors, motor drives) and Level 4/5 corporate enterprise systems. Cloud-tethered bioreactor architectures punch high-risk ingress holes through OT firewalls, triggering intense resistance from corporate IT security and quality compliance auditors.
- 21 CFR Part 11 Offline Resilience: When wide-area network (WAN) disruptions occur, edge-native nodes continue recording high-resolution sensor telemetry into local, append-only SQLite write-ahead logging (WAL) databases. Cryptographic SHA-256 hash chaining guarantees ALCOA+ data integrity (Attributable, Legible, Contemporaneous, Original, Accurate) with zero telemetry loss.
- On-Skid Physics-Informed Digital Twins: Deploying lightweight Extended Kalman Filters (EKF) and dynamic off-gas mass balances directly onto industrial edge micro-servers (ARM64 / x86-64 PREEMPT_RT) enables continuous, real-time estimation of Oxygen Uptake Rate ($\text{OUR}$), Carbon Evolution Rate ($\text{CER}$), and Respiratory Quotient ($\text{RQ}$) at $10\text{-}50\text{ Hz}$ in under $4\text{ milliseconds}$.
Over the past decade, the marketing promise of “Pharma 4.0” has revolved around centralized cloud data lakes. Bioprocess engineering teams were told that by piping every sensor stream—pH, dissolved oxygen, agitation speed, mass flow controllers, off-gas composition, and Raman spectra—into an AWS, Azure, or GCP hyperscaler, artificial intelligence would magically optimize antibody titers, eliminate batch aborts, and predict downstream contamination.
Yet inside commercial biomanufacturing suites and pilot development facilities, this cloud-centric paradigm has collided violently with the laws of physics, fluid dynamics, and operational technology (OT) reality. When a high-density Pichia pastoris or mammalian CHO fed-batch run enters its exponential growth phase, biological metabolic consumption rates surge exponentially. Waiting for a remote server thousands of miles away to ingest telemetry, execute a neural network, and return a setpoint change across a jittery public Internet connection is an architectural failure mode that costs millions in lost batches.
The bioprocess industry is undergoing an architectural correction: Edge-Native Bioreactor Management Systems (EBMS). By shifting data acquisition, high-frequency state estimation, safety interlocking, and adaptive control down to the physical skid boundary, biomanufacturers achieve deterministic, sub-second Closed-Loop Process Analytical Technology (PAT)—completely insulated from cloud outages, bandwidth throttling, and cybersecurity intrusion.

1. The Three Structural Failures of Cloud-Centric Bioprocess Control
To understand why edge-native execution is mandatory, one must examine where centralized cloud architectures break down across real biomanufacturing unit operations.
A. Control Loop Latency, Dead Time, and Phase Margin Destruction
In classic control theory, the stability of a closed-loop negative feedback system is dictated by its total loop dead time $\tau_{\text{dead}}$. In an edge-native setup, the total latency $\tau_{\text{loop}}$ between measurement and actuator output is constrained entirely by the local industrial bus (PROFINET, EtherCAT, or Modbus TCP) and on-skid compute cycle:
$$\tau_{\text{loop, edge}} = \tau_{\text{sensor}} + \tau_{\text{bus}} + \tau_{\text{compute}} + \tau_{\text{actuator}} \approx 2\text{ ms} + 1\text{ ms} + 3\text{ ms} + 10\text{ ms} \approx 16\text{ ms}$$
When that same control loop routes through an external cloud REST or MQTT API, network transport and serialization dominate the equation:
$$\tau_{\text{loop, cloud}} = \tau_{\text{sensor}} + \tau_{\text{bus}} + \tau_{\text{serialization}} + \tau_{\text{WAN}} + \tau_{\text{ingress}} + \tau_{\text{cloud, compute}} + \tau_{\text{egress}} + \tau_{\text{WAN}} + \tau_{\text{actuator}}$$
Under ideal conditions, $\tau_{\text{loop, cloud}}$ hovers between $200\text{ ms}$ and $450\text{ ms}$. However, during public Internet congestion, SSL renegotiation, or queue bufferbloat, $\tau_{\text{loop, cloud}}$ frequently spikes beyond $1,500\text{-}3,000\text{ ms}$.
The physical consequence on bioprocess control is devastating. Consider the phase lag $\phi_{\text{lag}}$ introduced into a bioreactor dissolved oxygen (DO) cascade controller operating at critical crossover frequency $\omega_c$:
$$\phi_{\text{lag}}(\omega_c) = -\omega_c \cdot \tau_{\text{dead}}$$
The system phase margin $\text{PM}$ is defined as:
$$\text{PM} = 180^\circ + \angle G(j\omega_c)$$
As dead time $\tau_{\text{dead}}$ balloons from $16\text{ ms}$ to $1,800\text{ ms}$, the phase margin is completely wiped out ($\text{PM} < 0^\circ$). The system transitions into an unstable, self-excited limit cycle: agitator speeds surge to maximum rpm ($>1,000\text{ rpm}$), pure oxygen sparge valves slam open, hydrodynamic shear rips mammalian cells apart, and the resulting lysis causes broth foaming that overwhelms sterile exhaust filters in minutes.
B. The ISA-95 Purdue Model and the Air-Gap Impasse
Pharmaceutical manufacturing plants are governed by the ANSI/ISA-95 enterprise-control system integration standard, historically implemented as the Purdue Enterprise Reference Architecture (PERA):
- Level 0: Physical Process: Bioreactor vessels, agitators, heating/cooling jackets, spargers, peristaltic pumps, harvest valves.
- Level 1: Basic Sensing & Manipulation: Electrochemical pH/DO probes, optical density sensors, RTDs, mass flow controllers, variable frequency drives (VFDs).
- Level 2: Supervisory & Unit Automation: Programmable Logic Controllers (PLCs), Industrial PCs (IPCs), skid Human-Machine Interfaces (HMIs).
- Level 3: Site Manufacturing Operations: Plant-wide SCADA (Supervisory Control and Data Acquisition), Batch Execution Systems (MES), local historian databases.
- Level 4/5: Enterprise & Cloud IT: Enterprise Resource Planning (ERP), corporate networks, public cloud analytics.
Between Level 2/3 (OT – Operational Technology) and Level 4/5 (IT – Information Technology) sits an Industrial Demilitarized Zone (IDMZ). Strict pharmaceutical validation (GAMP 5, 21 CFR Part 11) dictates that direct inbound Internet connections to Level 1 and Level 2 devices are strictly forbidden. Cloud-only architectures require punching reverse SSH tunnels, VPN tunnels, or WebSocket connections directly from cloud endpoints down into local skid controllers—creating unacceptable attack surfaces that IT and QA compliance officers routinely veto.
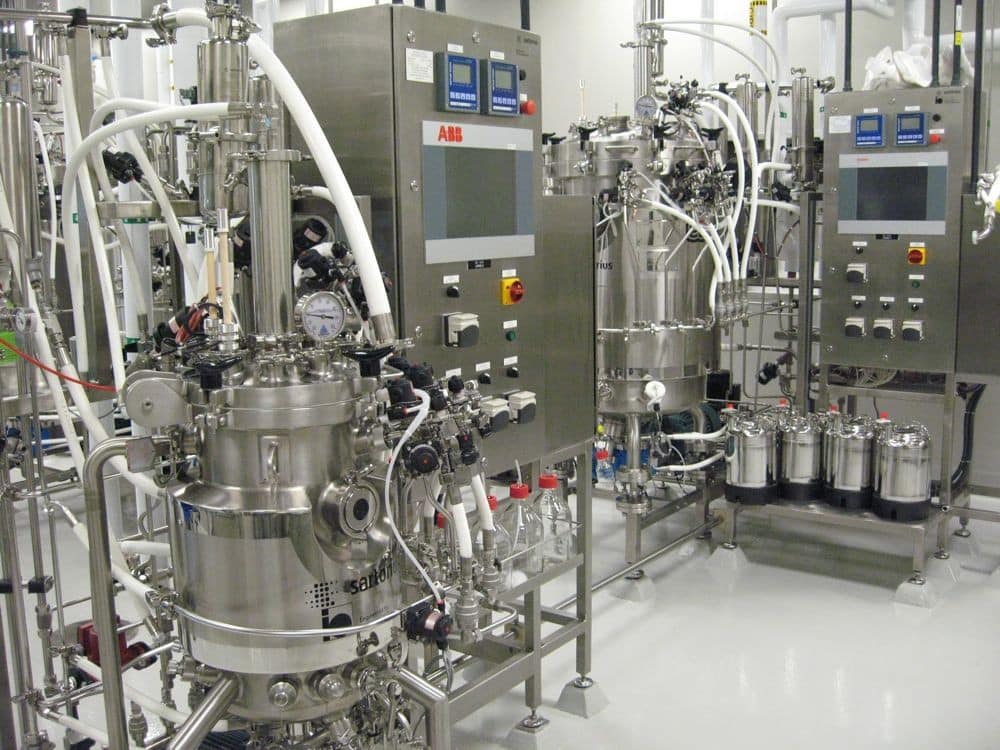
An Edge Bioreactor Management System (EBMS) sits directly in Level 2 as a dual-homed industrial gateway. It connects to Level 1 instrumentation via hardened OT fieldbuses (Modbus TCP, PROFINET, IO-Link), executes all critical state estimation and control locally, and exposes only unidirectional, read-only outbound telemetry (via encrypted MQTT Sparkplug B or OPC UA PubSub) to upper levels.
C. The High-Frequency PAT Telemetry Choke
Modern bioprocess monitoring is no longer restricted to slow, 1-second scalar values (temperature, pH, dissolved oxygen). Advanced Process Analytical Technology utilizes spectroscopic and visual PAT tools that generate continuous, multidimensional sensor tensors:
- Inline In Situ Raman Spectroscopy: 785 nm laser excitation collecting 1,024 to 2,048 spectral wavenumber channels every 10 to 30 seconds ($~150\text{ KB}$ per spectrum, including dark noise and baseline calibration).
- Quadrupole Off-Gas Mass Spectrometry: Real-time partial pressure scanning of $O_2, CO_2, N_2, Ar$, and volatile organic metabolites at $5\text{ Hz}$.
- Dielectric Spectroscopy (Radio-Frequency Biomass Sensors): Multi-frequency impedance sweeps ($100\text{ kHz}\text{-}20\text{ MHz}$) across 25 frequencies every $5\text{ seconds}$ to measure viable cell volume and membrane capacitance.
- Computer Vision Colony & Cell Morphometry: Automated automated digital imaging capturing microscopic frames at $5\text{-}10\text{ MB/frame}$ during harvest and seeding operations.
In a pilot facility with twelve 50 L to 500 L bioreactors running simultaneously, raw spectroscopic PAT streams generate between $15\text{ GB}$ and $40\text{ GB}$ of raw time-series tensors per day. Streaming these uncompressed tensors over WAN links creates massive bandwidth saturation, expensive egress charges, and data pipelines prone to packet loss. Edge deployment performs dimensionality reduction (Partial Least Squares Regression – PLSR, principal component projection, wavelet baseline subtraction) directly at the skid, outputting calibrated glucose ($g/L$), lactate ($g/L$), viable cell density ($10^6\text{ cells/mL}$), and viability ($\%$) locally in less than $50\text{ ms}$.
2. Governing Mathematical Mechanics: Real-Time On-Skid Edge Solvers
What sets an Edge Bioreactor Management System apart from a simple PLC is its ability to execute non-linear physical transport equations, mass balances, and recursive state estimators in real-time. Below are the core governing models implemented natively on modern edge compute nodes.
A. Dynamic Off-Gas Mass Balances: Real-Time OUR, CER, and RQ
The gold standard for detecting cellular metabolic shifts, substrate depletion, and oxygen limitation in aerobic fermentation is the instantaneous off-gas mass balance. Atmospheric inert nitrogen ($N_2$) and argon are neither consumed nor produced biologically ($\text{In} = \text{Out}$), allowing exact calculation of the exit gas flow rate $F_{\text{out}}$ via the inert gas balance:
$$F_{\text{in}} \cdot y_{N_2,\text{in}} = F_{\text{out}} \cdot y_{N_2,\text{out}}$$
$$F_{\text{out}} = F_{\text{in}} \cdot \left[ \frac{1 - y_{O_2,\text{in}} - y_{CO_2,\text{in}}}{1 - y_{O_2,\text{out}} - y_{CO_2,\text{out}}} \right]$$
Where $F_{\text{in}}$ is the standard volumetric gas feed rate ($\text{sL/min}$), $V_L$ is the dynamic liquid broth volume ($L$), and $y_i$ represents the mole fraction of species $i$ measured by off-gas sensors. The Oxygen Uptake Rate ($\text{OUR}$) and Carbon Dioxide Evolution Rate ($\text{CER}$) are solved dynamically at the edge:
$$\text{OUR} = \frac{F_{\text{in}}}{V_L} \cdot \left[ y_{O_2,\text{in}} - \left( \frac{1 - y_{O_2,\text{in}} - y_{CO_2,\text{in}}}{1 - y_{O_2,\text{out}} - y_{CO_2,\text{out}}} \right) \cdot y_{O_2,\text{out}} \right] \cdot \left( \frac{P_{\text{std}}}{R \cdot T_{\text{std}}} \right)$$
$$\text{CER} = \frac{F_{\text{in}}}{V_L} \cdot \left[ \left( \frac{1 - y_{O_2,\text{in}} - y_{CO_2,\text{in}}}{1 - y_{O_2,\text{out}} - y_{CO_2,\text{out}}} \right) \cdot y_{CO_2,\text{out}} - y_{CO_2,\text{in}} \right] \cdot \left( \frac{P_{\text{std}}}{R \cdot T_{\text{std}}} \right)$$
The Respiratory Quotient ($\text{RQ}$) is calculated instantaneously:
$$\text{RQ} = \frac{\text{CER}}{\text{OUR}}$$
In yeast and E. coli cultures, an immediate rise in $\text{RQ} > 1.15$ indicates the onset of overflow metabolism (Crabtree effect / acetate accumulation), signaling the on-skid feed pump to throttle glucose titration immediately. Conversely, a drop in $\text{RQ} < 0.80$ signals substrate starvation. Executing this calculation at $10\text{ Hz}$ on the edge prevents metabolic toxicity hours before offline bio-analyzer sampling could ever detect it.
B. Real-Time Volumetric Mass Transfer ($k_L a$) Estimation
The dynamic dissolved oxygen balance in the liquid phase is governed by:
$$\frac{dC_L}{dt} = k_L a (C^* - C_L) - \text{OUR}$$
Where $C_L$ is the dissolved oxygen concentration in liquid broth ($\text{mmol/L}$), $C^*$ is the equilibrium oxygen solubility at the gas-liquid interface, and $k_L a$ is the volumetric mass transfer coefficient ($\text{h}^{-1}$).
The equilibrium saturation concentration $C^*$ is not constant; it varies continuously with total headspace overpressure $P_{\text{head}}$, hydrostatic liquid height $H_L$, and Henry’s Law constant $H_{\text{Henry}}$:
$$C^* = \frac{P_{O_2,\text{eff}}}{H_{\text{Henry}}} = \frac{y_{O_2,\text{eff}} \cdot \left( P_{\text{head}} + \frac{1}{2} \rho_L g H_L \right)}{H_{\text{Henry}}}$$
By sampling liquid height (from load cells or hydrostatic differential transmitters), dissolved oxygen probe data, and headspace pressure sensors, the edge solver continuously solves for dynamic $k_L a(t)$:
$$k_L a(t) = \frac{\text{OUR}(t) + \frac{dC_L(t)}{dt}}{C^*(t) - C_L(t)}$$
If $k_L a(t)$ drops below the critical transport threshold while agitation and gassing remain constant, the edge controller detects impeller fouling, sparger pore clogging, or severe broth viscosity changes—triggering automated preventative alarms before cell asphyxiation occurs.
C. Embedded Extended Kalman Filter (EKF) State Estimator
In industrial fermentation, key biological state variables—such as intracellular viable biomass $X(t)$, substrate concentration $S(t)$, and inhibitory metabolite concentration $P_{\text{met}}(t)$—cannot be measured continuously by standard probes. The edge system runs a non-linear Extended Kalman Filter (EKF) as an embedded software observer.
Consider the non-linear bioprocess dynamic state model:
$$\frac{d}{dt} \begin{bmatrix} X \cr S \cr P_{\text{met}} \end{bmatrix} = \begin{bmatrix} \mu(S, P_{\text{met}}) X - D X \cr -\frac{1}{Y_{X/S}} \mu(S, P_{\text{met}}) X - m_s X + D (S_{\text{feed}} - S) \cr q_p(S) X - D P_{\text{met}} \end{bmatrix} + \mathbf{w}_t$$
Where $D = F_{\text{feed}} / V_L$ is the dilution rate, $\mu$ follows Haldane or Monod substrate-inhibition kinetics, $m_s$ is maintenance coefficient, and $\mathbf{w}_t \sim \mathcal{N}(0, \mathbf{Q})$ represents process noise.
At each discrete time step $k$ ($\Delta t = 100\text{ ms}$), the edge system evaluates the discrete predict step:
$$\hat{\mathbf{x}}{k|k-1} = \hat{\mathbf{x}}{k-1|k-1} + \int_{t_{k-1}}^{t_k} \mathbf{f}(\mathbf{x}(\tau), \mathbf{u}(\tau)) d\tau$$
$$\mathbf{P}{k|k-1} = \mathbf{F}{k-1} \mathbf{P}{k-1|k-1} \mathbf{F}{k-1}^T + \mathbf{Q}$$
Where $\mathbf{F}_{k-1} = \left. \frac{\partial \mathbf{f}}{\partial \mathbf{x}} \right|_{\hat{\mathbf{x}}_{k-1|k-1}}$ is the Jacobian matrix computed via analytical derivatives. When asynchronous sensor measurements arrive (e.g. Raman glucose prediction, off-gas OUR, optical density probe), the edge node executes the update step in less than $2\text{ milliseconds}$:
$$\mathbf{K}k = \mathbf{P}{k|k-1} \mathbf{H}k^T \left( \mathbf{H}_k \mathbf{P}{k|k-1} \mathbf{H}_k^T + \mathbf{R} \right)^{-1}$$
$$\hat{\mathbf{x}}{k|k} = \hat{\mathbf{x}}{k|k-1} + \mathbf{K}k \left( \mathbf{z}_k - \mathbf{h}(\hat{\mathbf{x}}{k|k-1}) \right)$$
$$\mathbf{P}{k|k} = (\mathbf{I} - \mathbf{K}_k \mathbf{H}_k) \mathbf{P}{k|k-1}$$
This edge-resident state estimation provides noise-free, reconstructed concentrations of glucose and biomass continuously, feeding into Model Predictive Control (MPC) algorithms that adjust peristaltic feed pumps deterministically.
3. Architectural Deep Dive: Cloud SCADA vs. Edge-Native Bioreactor Management
To assist automation leads, validation managers, and bioprocess engineers evaluating infrastructure upgrades, the following engineering matrix provides a rigorous comparison between centralized cloud architectures and edge-native deployments:
| Architecture Dimension | Centralized Cloud Bioprocess Architecture | Edge-Native Bioreactor Management (EBMS) |
|---|---|---|
| Control Loop Latency ($\tau_{\text{loop}}$) | $250\text{ ms}\text{-}2,500\text{ ms}$ (Stochastic Internet jitter) | $2\text{ ms}\text{-}15\text{ ms}$ (Deterministic industrial bus & RTOS) |
| ISA-95 / Purdue Air-Gap Compliance | Violated. Inbound cloud connections pierce Level 1/2 OT firewall. | Preserved. Dual-homed edge gateway; isolated Level 1/2 subnet. |
| PAT Spectroscopic Ingestion (Raman/NIR) | Raw spectral matrices streamed to cloud; high bandwidth egress fees. | On-skid PLSR chemometrics; outputs calibrated states ($<50\text{ ms}$). |
| WAN Outage Resilience | Critical failure. Closed-loop model execution and telemetry halt. | 100% Autonomous. Local SQLite WAL logging; auto-resync when restored. |
| 21 CFR Part 11 ALCOA+ Audit Trail | Vulnerable to missing records during transport dropouts. | Cryptographic SHA-256 hash chaining on NVMe; tamper-evident journal. |
| Operating System & Determinism | General-purpose VM / cloud container (Non-real-time scheduling). | Linux PREEMPT_RT or hard real-time microkernel (QNX / Zephyr). |
| Off-Gas Kinetics (OUR / CER / RQ) | Delayed by batch cloud ingestion queues ($1\text{-}5\text{ min}$ lag). | Sub-second execution ($10\text{ Hz}$); instant overflow throttling. |
| Failure Mode Containment | Cloud provider regional outage halts multi-plant operations. | Zero blast radius. Each skid is completely isolated and self-sufficient. |
| Asset Risk per 10,000 L Batch | High risk ($1.5M–$4.0M exposure to network dropouts). | Zero network risk. Skid executes full validated recipe offline. |
4. On-Skid Hardware Architecture: Designing the Edge Node
Implementing an industrial Edge Bioreactor Management System requires purpose-built hardware capable of operating in classified cleanroom environments (ISO 7 / ISO 8, Class C / D) with IP65/IP67 washdown ingress protection.
A. Dual-NIC Physical Network Topology
The edge compute node is deployed with physically decoupled network interfaces to guarantee strict boundary isolation:
- Internal OT Interface (NIC 1 – Subnet 192.168.10.x): Dedicated exclusively to Level 1 and Level 2 devices. Communicates over deterministic industrial protocols:
- Modbus TCP / RTU (RS-485): Interfacing peristaltic dosing pumps, thermal mass flow controllers (MFCs), and heating chillers.
- IO-Link Master: Digital communication with smart digital pH/redox probes, optical dissolved oxygen transmitters, and pressure sensors.
- OPC UA Server (Local): Native interface to legacy skid PLCs (Siemens S7-1500, Allen-Bradley ControlLogix, Beckhoff CX).
- Upstream Plant Interface (NIC 2 – Subnet 10.200.x.x): Connects directly to the Level 3 plant network or IDMZ. Transmits lightweight, standardized JSON/Avro payloads via:
- MQTT Sparkplug B: State-aware, bandwidth-efficient telemetry with birth/death certificates, ensuring supervisory SCADA immediately knows edge skid status.
- OPC UA PubSub: Encrypted, deterministic publish-subscribe architecture for site-wide historian ingestion (OSIsoft PI, Aveva, InfluxDB).
B. Silicon Selection & Real-Time OS (RTOS)
Depending on whether the bioreactor requires simple mass balance calculations or heavy computer vision / spectral chemometrics, edge hardware typically falls into two categories:
- Micro-Edge (ARM Cortex-A72 / A53, e.g. Raspberry Pi Compute Module 4, Siemens IOT2050): Ideal for benchtop 1 L to 10 L vessels executing real-time OUR/CER/RQ mass balances, PID cascade control, and SQLite audit logging. Consumes $<15\text{ W}$, fanless DIN-rail mountable.
- Industrial Edge IPC with AI Acceleration (Intel Core i7/Xeon or NVIDIA Jetson Orin Nano/NX): Equipped with hardware Tensor Cores or NPU. Mandatory for skids integrating inline Raman spectroscopy, real-time NIR regression, or digital holographic microscopy for live cell morphology. Executes 1,024-wavenumber chemometric matrix inversions in $<8\text{ ms}$.
On top of the silicon, the edge operating system runs a Linux kernel patched with PREEMPT_RT. This guarantees deterministic worst-case interrupt latency of less than $50\text{ microseconds}$, ensuring critical safety routines—such as emergency anti-foam dosing or agitator torque tripping—execute with zero OS scheduling jitter.
5. 21 CFR Part 11 Compliance & Cryptographic Edge Ledgers
One of the most persistent misconceptions among validation engineers is that edge computing violates 21 CFR Part 11 and cGMP data integrity guidelines because data is stored locally on decentralized devices. In reality, a properly engineered edge system provides far superior ALCOA+ compliance than centralized cloud servers.
A. Write-Ahead Logging (WAL) and Cryptographic Block Chaining
When an edge node records a process measurement, it writes directly to an embedded SQLite database configured in Write-Ahead Logging (WAL) mode with synchronized filesystem flushing (PRAGMA synchronous = FULL). This guarantees zero corruption even during sudden cleanroom power loss.
To satisfy 21 CFR Part 11 requirements for tamper-evident audit trails, each sensor transaction is sealed in an on-skid cryptographic hash chain:
$$h_n = \text{SHA-256}\Big( h_{n-1} \parallel t_n \parallel \mathbf{y}_n \parallel \mathbf{u}_n \parallel \text{OperatorID}_n \parallel \text{BatchID} \Big)$$
Where $h_{n-1}$ is the cryptographic digest of the prior record, $t_n$ is the UTC timestamp synchronized via local NTP, $\mathbf{y}_n$ is the sensor vector, and $\mathbf{u}_n$ is the control action vector. If an unauthorized actor attempts to alter a pH value, alarm limit, or dosing volume retroactively in the local database file, the cryptographic chain is broken immediately:
$$\text{SHA-256}\Big( h_{n-1}^* \parallel t_n \parallel \mathbf{y}_n^* \parallel \dots \Big) \neq h_n$$
During batch release audits, the edge node exports a cryptographically signed PDF/JSON batch record containing the root hash. QA verification of millions of data points takes seconds, proving beyond mathematical doubt that no data was altered between inoculation and harvest.
B. The Store-and-Forward Re-Synchronization Engine
During routine operations, the edge node streams decimated summary telemetry (e.g. 1-minute averages) to the enterprise cloud historian. If the plant network is severed—due to switch maintenance, fiber cut, or WAN outage—the edge node enters Autonomous Isolation Mode.
All high-resolution ($10\text{ Hz}$) data points continue logging into local NVMe solid-state storage. When network connectivity is re-established, the edge node’s store-and-forward engine negotiates with the upstream MQTT broker, automatically backfilling missing records chronologically without duplicate keys or timestamp distortion. The cloud historian recovers full fidelity without a single gap in the regulatory record.
6. The Future: Containerized Bioprocess Micro-Services and Edge Mesh
Edge deployment does not mean discarding the cloud entirely. Instead, biomanufacturing is adopting a Hybrid Edge-Cloud Topology using OCI-compliant lightweight containers (Docker / K3s / containerd):
- Cloud Layer (Fleet Orchestration & Model Training): Centralized servers aggregate historical batches across global facilities, training deep physics-informed neural networks (PINNs) and chemometric Raman models across hundreds of runs.
- Over-the-Air (OTA) Model Deployment: Validated model weights and recipe parameters are containerized, cryptographically signed, and pushed down to on-skid edge nodes via GitOps pipelines (ArgoCD / Helm).
- Edge Layer (Deterministic Real-Time Execution): The local skid runs the containerized model within dedicated cgroups memory and CPU quotas, executing inference deterministically at the microsecond level.
This decoupled architecture achieves the ultimate bioprocessing synthesis: enterprise-wide machine learning scale in the cloud, backed by unshakeable, deterministic, air-gapped physical execution at the vessel wall.
Explore BioFlo Interactive Bioprocess Engineering Workbench
Model, scale, and optimize your upstream and downstream bioprocess operations with first-principles hydrodynamic calculators, cell density tools, and computer vision Colony Counters directly in your browser.
Bioreactor 5L Simulator
Simulate dissolved oxygen cascade control, $k_L a$ dynamics, and agitator shear gradients in benchtop reactors.
OD & Kinetics Calculator
Convert optical density ($OD_{600}$) to dry cell weight and calculate instantaneous doubling times and specific growth rate $\mu$.
BioFlo PetriCount
Computer vision colony counter for active viable cell verification, bioburden testing, and environmental monitoring.
Deploying edge management systems on your pilot or production bioprocess trains?