

⚡ Executive Summary for Bioprocess Architects & Biochemical Engineers
- The Volumetric Productivity Paradigm: Commodity biofuels and biochemicals cannot survive economically on legacy fed-batch fermentation. Batch turnarounds, lag phases, and dilute titers limit space-time yields to $1.5\text{–}3.0\text{ g/L/h}$. Continuous bioreactors with membrane cell retention shatter this barrier, delivering steady-state productivities exceeding $15\text{–}25\text{ g/L/h}$ ($>6\times$ intensification).
- Recalcitrant Biomass Upgrading: Fractionating lignocellulosic biomass (agricultural straw, bagasse, forestry residues) requires a tightly orchestrated 3-stage chain: mechanical comminution ($d_p < 2\text{ mm}$), thermochemical hydrolysis (delignification and hemicellulose solubilization), and multi-enzyme saccharification yielding fermentable C5 (xylose) and C6 (glucose) streams without generating toxic dehydration inhibitors (furfural, 5-HMF).
- The Syngas Gas-Liquid Mass Transfer Barrier: When utilizing lignin gasification or industrial off-gas ($CO + H_2$), gas solubility is notoriously poor (Henry’s constant for $CO$ is $H \approx 1.0\times 10^5\text{ bar}\cdot\text{L/mol}$). Microbubble spargers ($d_b \approx 100\text{–}500\ \mu\text{m}$) skyrocket specific interfacial area ($a > 1,000\text{ m}^{-1}$), achieving $k_L a > 120\text{ h}^{-1}$ without catastrophic impeller power draw.
- Membrane-Decoupled Chemostats: By coupling a Continuous Stirred Tank Reactor (CSTR) to an external crossflow microfiltration/ultrafiltration loop, the hydraulic retention time ($\text{HRT} = 1/D$) is decoupled from the solids retention time ($\text{SRT}$). Biomass builds to extreme densities ($>60\text{ g DCW/L}$), eliminating chemostat washout limits.
- CFD Digital Twins & Closed-Loop AI: Multiphase Computational Fluid Dynamics (CFD) resolves velocity shear fields, gas hold-up, and dead zones, while real-time AI sensors (Raman, off-gas mass spectrometry) continuously adjust dilution rates ($D$) and gas recirculation to sustain peak metabolic flux.
The global transition from fossil-derived petrochemicals to carbon-neutral biofuels, bio-monomers, and green chemicals faces a brutal techno-economic reality: scale-up economics and space-time yields. For high-value therapeutic proteins, a fed-batch bioreactor running at $3\text{–}5\text{ g/L}$ over 14 days is commercially viable. But for commodity biochemicals—ethanol, butanol, 1,3-propanediol, and succinic acid—margins are paper-thin, substrate costs dominate, and capital expenditure (CapEx) per liter of annual capacity dictates survival.
To compete with petroleum, industrial biomanufacturing is undergoing a monumental paradigm shift called Process Intensification (PI). Rather than building gargantuan 500,000-liter batch fermenters with multi-meter hydrostatic gradients and day-long clean-in-place (CIP) cycles, modern biochemical facilities deploy continuous, membrane-intensified CSTRs guided by multiphase CFD digital twins, microbubble gas sparging, and closed-loop downstream separation.
Below is the complete engineering architecture of this next-generation closed-loop biorefinery flowsheet, examining every unit operation from raw lignocellulosic biomass comminution to real-time AI telemetry and continuous downstream gas recycling.
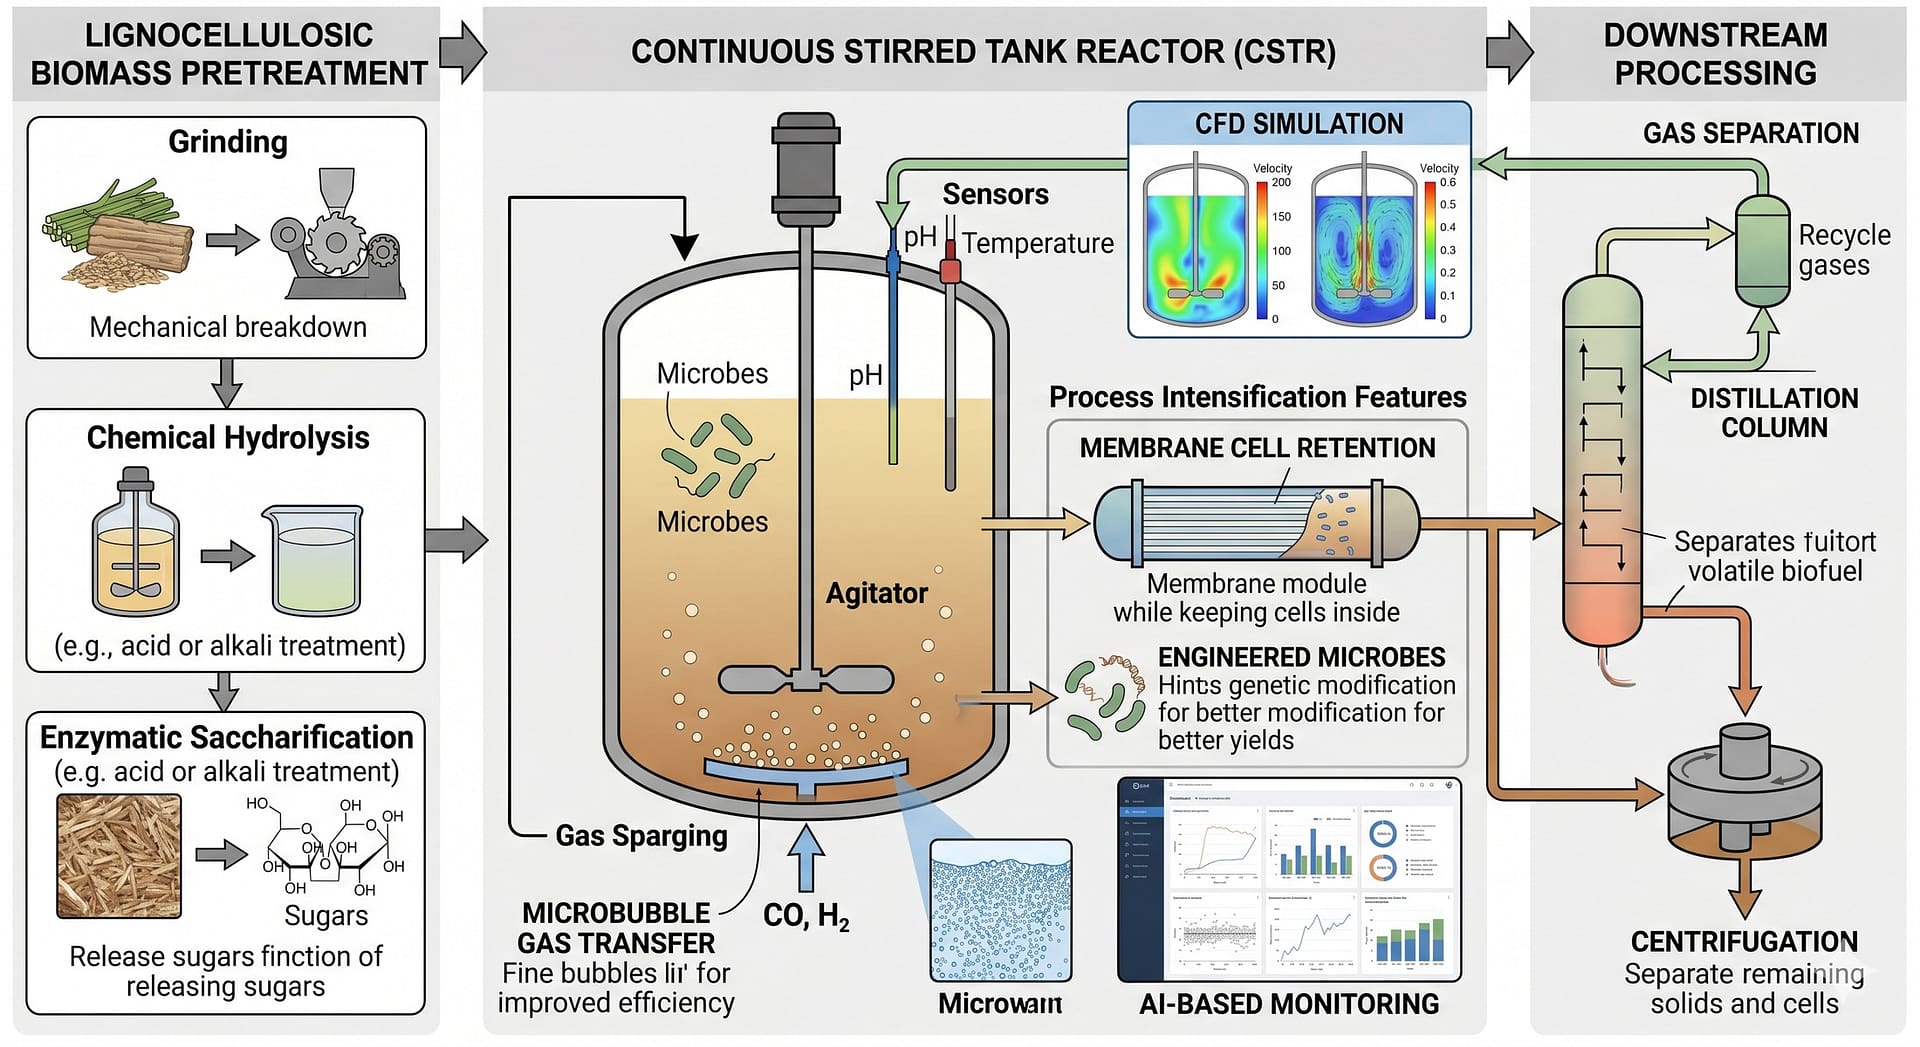
1. Upstream Upgrading: Lignocellulosic Biomass Fractionation & Saccharification
Non-food lignocellulosic biomass (corn stover, sugarcane bagasse, wheat straw, switchgrass, and forest thinnings) represents the planet’s most abundant renewable carbon reservoir. However, plant evolution has spent hundreds of millions of years engineering this matrix to resist biochemical degradation. Cellulose microfibrils are shielded within an amorphous matrix of hemicellulose and cemented by an impermeable aromatic polymer sheath: lignin.
Unlocking this carbon requires an integrated, high-recovery three-stage fractionation train:
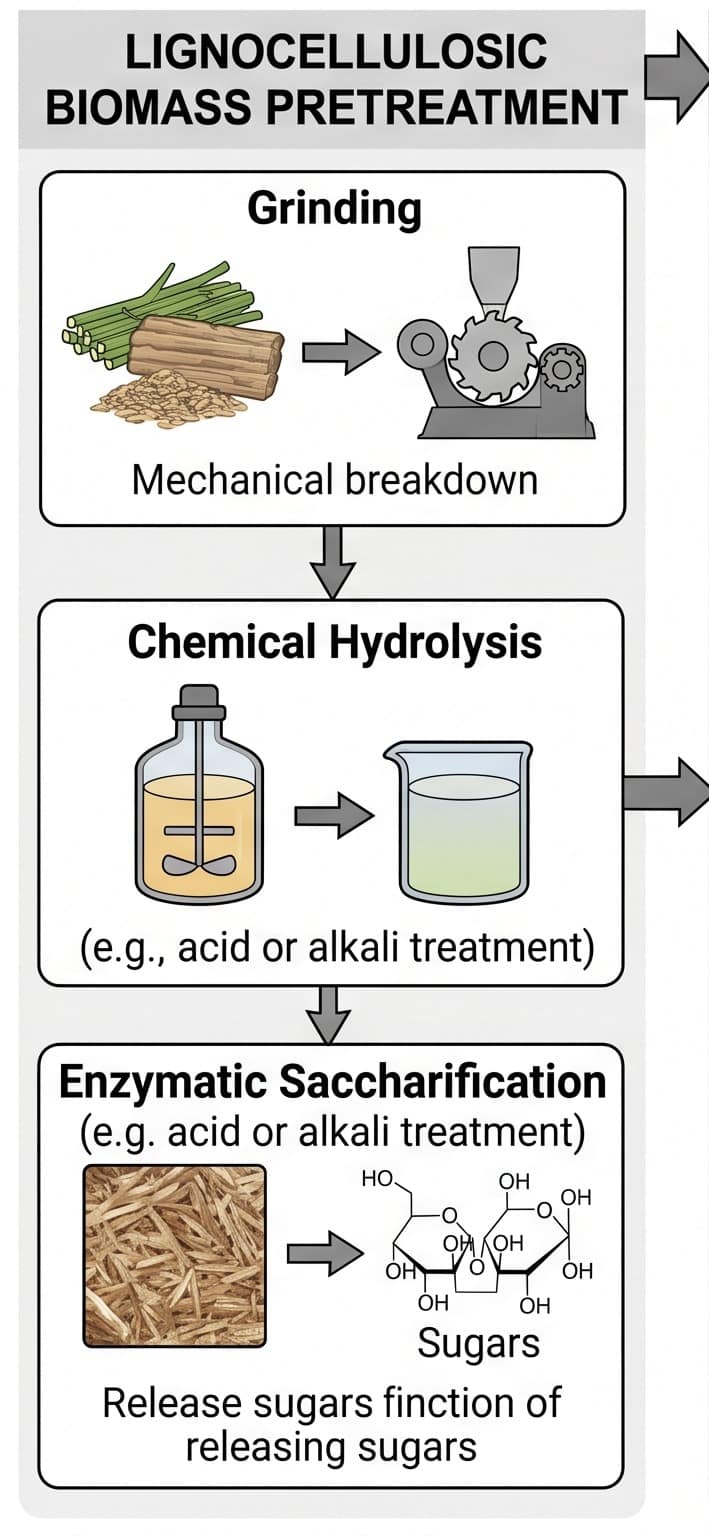
Phase 1: Mechanical Comminution & Grinding
Raw biomass is first fed through rotary knife mills and hammer crushers to reduce particle size from centimeters down to $0.5\text{–}2.0\text{ mm}$. The engineering objective is threefold:
- Expand specific accessible surface area ($S_a$, increasing from $<0.5\text{ m}^2/\text{g}$ to $>4\text{ m}^2/\text{g}$).
- Disrupt cellular macro-structures and shear the protective waxy cuticle.
- Lower slurry viscosity during downstream pumping and heat exchange.
Phase 2: Chemical Hydrolysis & The Inhibitor Boundary
Comminuted biomass undergoes thermochemical pretreatment to solubilize hemicellulose and alter lignin structure, exposing crystalline cellulose to enzymes. Common industrial methods include:
- Dilute Acid Pretreatment ($0.5\text{–}1.5\text{ wt\% } \text{H}_2\text{SO}_4$, $160\text{–}190^\circ\text{C}$, $5\text{–}15\text{ min}$): Selectively hydrolyzes xylan hemicellulose into monomeric xylose with $>85\%$ recovery. The Critical Trade-Off: Excessive residence time or temperature dehydrates pentose sugars into furfural and hexose sugars into 5-hydroxymethylfurfural (5-HMF), potent microbial inhibitors that arrest glycolysis.
- Alkali Pretreatment ($\text{NaOH}$ or $\text{Ca(OH)}_2$, $60\text{–}120^\circ\text{C}$): Cleaves ester and ether bonds in lignin-carbohydrate complexes, removing up to $60\text{–}70\%$ of lignin without dehydrating sugars. Favored for low-lignin agricultural residues like straw.
- Hydrothermal / Steam Explosion ($180\text{–}220^\circ\text{C}$, $10\text{–}30\text{ bar}$): Auto-hydrolysis catalyzed by organic acids released from hemicellulose acetyl groups, followed by explosive pressure release that shears biomass fibers.
Phase 3: Enzymatic Saccharification
The conditioned cellulose pulp is pumped into saccharification reactors charged with optimized multi-enzyme cocktails at $50^\circ\text{C}$, $\text{pH } 4.8\text{–}5.2$:
- Endoglucanases (EG): Randomly cleave internal amorphous $\beta$-1,4-glucosidic bonds, generating free chain ends.
- Cellobiohydrolases / Exoglucanases (CBH I & II): Processively cleave cellobiose dimers from reducing and non-reducing chain ends.
- $\beta$-Glucosidases (BGL): Hydrolyze soluble cellobiose into monomeric glucose, relieving cellobiose-induced feedback inhibition of CBH enzymes.
- Hemicellulases (Endo-xylanases & $\beta$-xylosidases): Cleave residual arabinoxylan backbones, releasing D-xylose and L-arabinose.
The resulting enzymatic hydrolysate contains a rich sugar mixture: $60\text{–}80\text{ g/L glucose}$ (hexose) and $25\text{–}40\text{ g/L xylose}$ (pentose), ready for continuous reactor feeding.
2. The Core Engine: Continuous Stirred Tank Reactor (CSTR) Kinetics
Why abandon batch and fed-batch fermentation in favor of a continuous CSTR? The answer lies in the fundamental rate equation of bioprocess kinetics:
Governing Mass Balances for an Ideal Chemostat:
Biomass: dX / dt = (μ − D) · X
Substrate: dS / dt = D · (S0 − S) − (μ · X / YX/S) − ms · X
Where $D = F / V$ is the dilution rate ($\text{h}^{-1}$), $S_0$ is inlet feed substrate concentration ($\text{g/L}$), $\mu$ is specific growth rate ($\text{h}^{-1}$), $Y_{X/S}$ is biomass yield on substrate ($\text{g/g}$), and $m_s$ is maintenance coefficient.
At steady state ($dX/dt = 0$), the chemostat imposes a strict kinetic constraint: $\mu = D$. The operator controls cellular growth rate simply by dialing the feed pump volumetric rate $F$!
The Washout Dilemma of Traditional Chemostats
In a simple chemostat without cell retention, if an engineer attempts to maximize volumetric throughput by increasing $D$ beyond the maximum specific growth rate ($\mu_{\text{max}}$), the culture crashes over the washout cliff ($dX/dt < 0 \implies X \to 0$). Cells are pumped out of the vessel faster than biological binary fission can replace them.
Because commodity microbial cell lines typically operate at $\mu_{\text{max}} \approx 0.20\text{–}0.40\text{ h}^{-1}$, biomass density in a standard chemostat rarely exceeds $5\text{–}15\text{ g DCW/L}$. Volumetric productivity ($Q_p = D \cdot P$) hits an economic bottleneck.
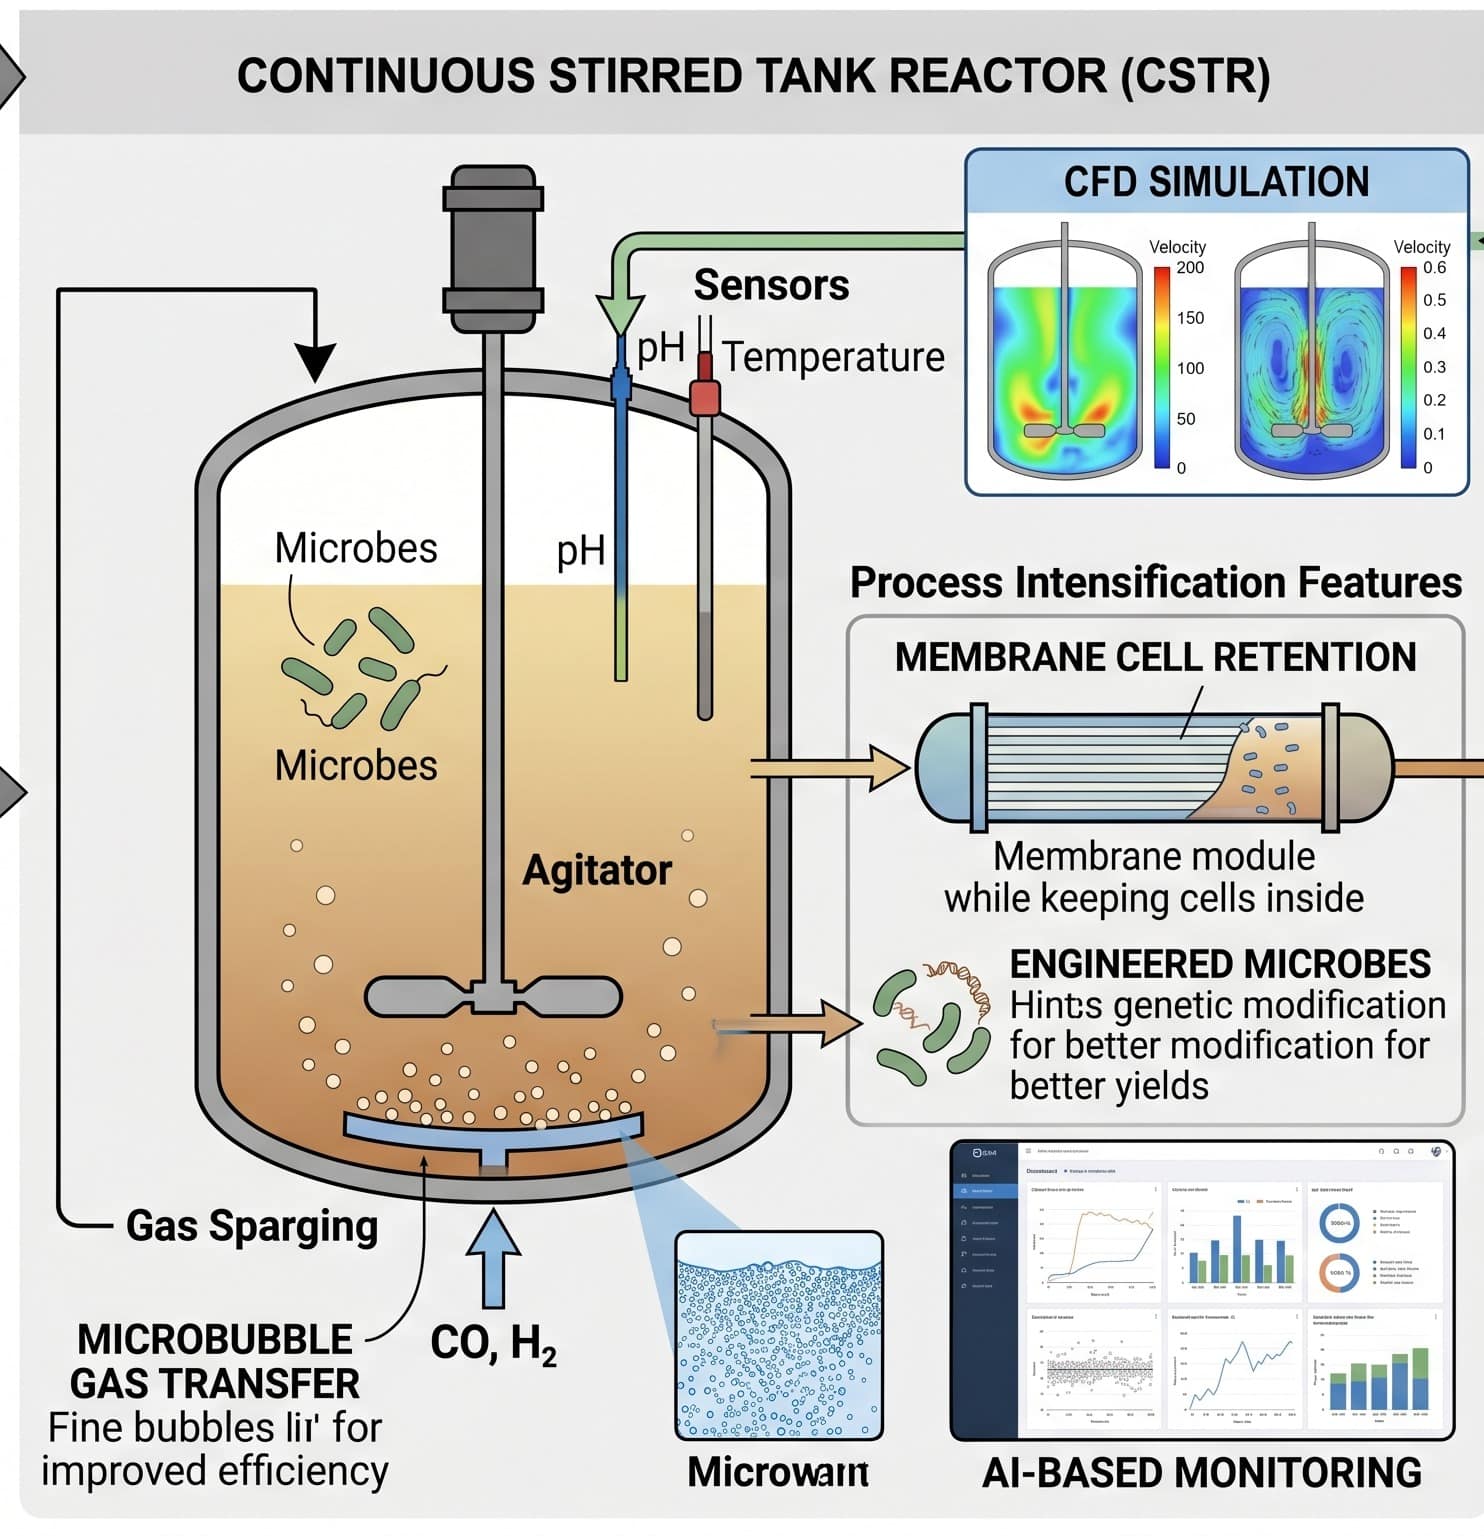
3. Process Intensification Pillar 1: Membrane Cell Retention (Perfusion CSTR)
To break through the chemostat washout limit, process engineers decouple the hydraulic retention time ($\text{HRT} = 1/D$) from the solids/biomass retention time ($\text{SRT}$) using an external crossflow filtration membrane module (Figure 3).
Derivation of Intensified Cell Retention Kinetics
Consider a CSTR connected to an external crossflow ultrafiltration or microfiltration loop. A bleed stream with flow rate $F_{\text{bleed}}$ is removed directly from the reactor broth to purge dead cells and maintain viability, while cell-free permeate $F_{\text{perm}}$ is harvested through the membrane barrier:
$F_{\text{in}} = F_{\text{harvest}} = F_{\text{perm}} + F_{\text{bleed}}$
Define the total dilution rate $D = F_{\text{in}} / V$ and the bleed fraction $b = F_{\text{bleed}} / F_{\text{in}}$. Let the membrane cell retention coefficient be $B = 1 – (X_{\text{perm}} / X)$. For a defect-free microfiltration membrane ($0.1\text{–}0.2\ \mu\text{m}$), $X_{\text{perm}} = 0$, so $B = 1.0$. The steady-state biomass balance becomes:
\mu = D \cdot (1 – B) + b \cdot D = b \cdot D = \frac{F_{\text{bleed}}}{V}
💡 The Architectural Breakthrough:
Notice what this equation proves! The cellular growth rate $\mu$ is now governed strictly by the tiny bleed rate $b$, completely independent of the total harvest dilution rate $D$! An operator can ramp total dilution rate $D$ up to $0.8\text{–}1.5\text{ h}^{-1}$ (well past $\mu_{\text{max}}$), continuously washing out inhibitory metabolites while cell density inside the CSTR accumulates to $50\text{ to }80+\text{ g DCW/L}$ ($>10^9\text{ cells/mL}$).
Because volumetric productivity is directly proportional to active biomass density ($Q_p = q_p \cdot X$), boosting cell concentration by $5\times$ to $8\times$ causes space-time yield to surge from $2.5\text{ g/L/h}$ to $>18\text{ g/L/h}$. A single 10,000 L intensified membrane CSTR outproduces a 100,000 L fed-batch vessel!
4. Process Intensification Pillar 2: Syngas Microbubble Gas Transfer ($CO, H_2$)
Notice the dual feed arrows in Figure 1 and Figure 3: in addition to lignocellulosic hydrolysate, modern intensified biorefineries can operate on synthesis gas (syngas: $CO + H_2 + CO_2$) derived from thermal gasification of recalcitrant lignin waste, municipal solid waste (MSW), or industrial blast-furnace emissions.
The Microbial Biology: The Wood-Ljungdahl Pathway
Acetogenic biocatalysts like Clostridium autoethanogenum and Clostridium ljungdahlii utilize the ancient reductive acetyl-CoA (Wood-Ljungdahl) pathway to fix carbon monoxide and carbon dioxide into acetyl-CoA, driving continuous synthesis of fuel-grade ethanol and butanol:
$6\text{ CO} + 3\text{ H}_2\text{O} \longrightarrow \text{CH}_3\text{CH}_2\text{OH} + 4\text{ CO}_2 \quad (\Delta G^\circ = -217.9\text{ kJ/mol})$
$2\text{ CO}_2 + 6\text{ H}_2 \longrightarrow \text{CH}_3\text{CH}_2\text{OH} + 3\text{ H}_2\text{O} \quad (\Delta G^\circ = -97.3\text{ kJ/mol})$
The Gas Solubility Crisis & Microbubble Physics
The thermodynamic barrier to syngas fermentation is not enzymatic kinetics; it is gas-to-liquid mass transfer. At $37^\circ\text{C}$, the Henry’s Law constants for syngas components reveal an extreme solubility deficit compared to soluble sugars:
| Solute / Gas | Henry’s Law Constant ($H_i$, bar·L/mol) | Aqueous Saturation at 1 bar ($C^*$, mM) | Mass Transfer Regulating Regime |
|---|---|---|---|
| Glucose (Sugar) | N/A (Miscible) | $>1,000\text{ mM}$ ($>180\text{ g/L}$) | Bulk liquid convective transport |
| Oxygen ($\text{O}_2$) | $46,500$ | $0.218\text{ mM}$ (in air) | Gas-liquid film resistance ($k_L a$) |
| Carbon Monoxide ($\text{CO}$) | $105,000$ | $0.952\text{ mM}$ | Severe gas-liquid mass transfer limitation |
| Hydrogen ($\text{H}_2$) | $128,000$ | $0.781\text{ mM}$ | Critical bottleneck; rate-limiting electron donor |
Because dissolved $H_2$ saturation is less than $1\text{ millimolar}$, the Gas Transfer Rate ($\text{GTR}$) directly throttles the entire metabolic pathway:
\text{GTR} = k_L a \cdot \left( C^*_G – C_L \right) = q_G \cdot X
Standard open-pipe or drilled-hole spargers produce large bubbles ($d_b \approx 3\text{–}6\text{ mm}$), yielding low specific interfacial area ($a \approx 100\text{–}200\text{ m}^{-1}$). Trying to force mass transfer by cranking agitator speed burns millions of kilowatt-hours and shears the cells.
The Solution: Microbubble Sintered / Laser Spargers. By deploying microsparging elements producing fine bubbles ($d_b \approx 100\text{–}400\ \mu\text{m}$), specific interfacial area ($a = 6 \varepsilon_G / d_b$) increases by an order of magnitude. Gas transfer coefficients jump from $k_L a \approx 30\text{ h}^{-1}$ to $k_L a > 140\text{ h}^{-1}$, instantly unlocking high syngas conversion rates without mechanical shear overload.
5. Computational Fluid Dynamics (CFD): Eliminating Dead Zones & Shear Hotspots
In an intensified CSTR running at $>50\text{ g DCW/L}$ with continuous gas sparging, internal hydrodynamic heterogeneity is the number one cause of batch failure. As highlighted by the CFD Simulation inset in Figure 1:
- Velocity Vector & Contour Fields: Turbulent kinetic energy dissipation ($\varepsilon$) varies by over two orders of magnitude between the impeller discharge tip ($\varepsilon_{\text{max}} \sim 10\text{–}30 \times \bar{\varepsilon}$) and the upper fluid surface. CFD modeling ensures that cells do not experience local energy dissipation rates exceeding their critical mechanical shear threshold ($\tau_{\text{crit}} \approx 10\text{–}15\text{ Pa}$).
- Dead Zone Eradication: At high cell densities, broth rheology often shifts from Newtonian to pseudoplastic shear-thinning (Casson or power-law fluid). In poorly agitated zones near vessel baffles or lower corner radii, apparent viscosity spikes, creating stagnant “dead pockets” where cells starve and autolyze. CFD identifies these low-velocity stagnation zones, allowing engineers to optimize impeller-to-tank diameter ratios ($D/T = 0.35\text{–}0.45$) and install angled bottom dish baffles.
- Gas Cavity & Impeller Flooding Prevention: CFD multi-fluid Eulerian-Eulerian simulations predict the exact gas flow number ($Fl_g = Q_g / N D^3$) where gas cavities behind the impeller blades begin to bridge, preventing impeller flooding and motor torque drops.
6. AI-Based Digital Twin Monitoring & Closed-Loop PAT Control
Operating an intensified membrane CSTR at high dilution rates and dense biomass is inherently dynamic. A small drift in feedstock sugar concentration, a spike in furfural inhibitors, or membrane biofouling can trigger rapid process instability.
Modern facilities deploy an AI-Based Monitoring Digital Twin (Figure 1, bottom right) operating on real-time Process Analytical Technology (PAT):
The Closed-Loop AI Control Hierarchy:
- In-Line Spectroscopy & Soft Sensors: In-situ Raman and Near-Infrared (NIR) immersion probes continuously measure glucose, xylose, and ethanol concentrations every 60 seconds without sampling delay.
- Off-Gas Mass Spectrometry: Continuously analyzes exhaust gas composition ($CO, H_2, CO_2, CH_4$). By computing the real-time Carbon Dioxide Evolution Rate ($\text{CER}$) and Respiratory Quotient ($\text{RQ}$), soft sensors compute live cell viability and specific metabolic activity ($q_p$).
- Physics-Informed Neural Networks (PINNs): Instead of “black box” machine learning, PINNs constrain neural predictions within fundamental conservation laws of mass and thermodynamics ($\sum m_{\text{in}} – \sum m_{\text{out}} = dm/dt$).
- Automated Feedback Actuation: If the model detects sugar accumulation ($S > S_{\text{crit}}$) indicating metabolic inhibition, the controller automatically modulates dilution rate $D$, adjusts bleed flow $F_{\text{bleed}}$, or triggers a rapid backwash pulse across the cell retention membrane.
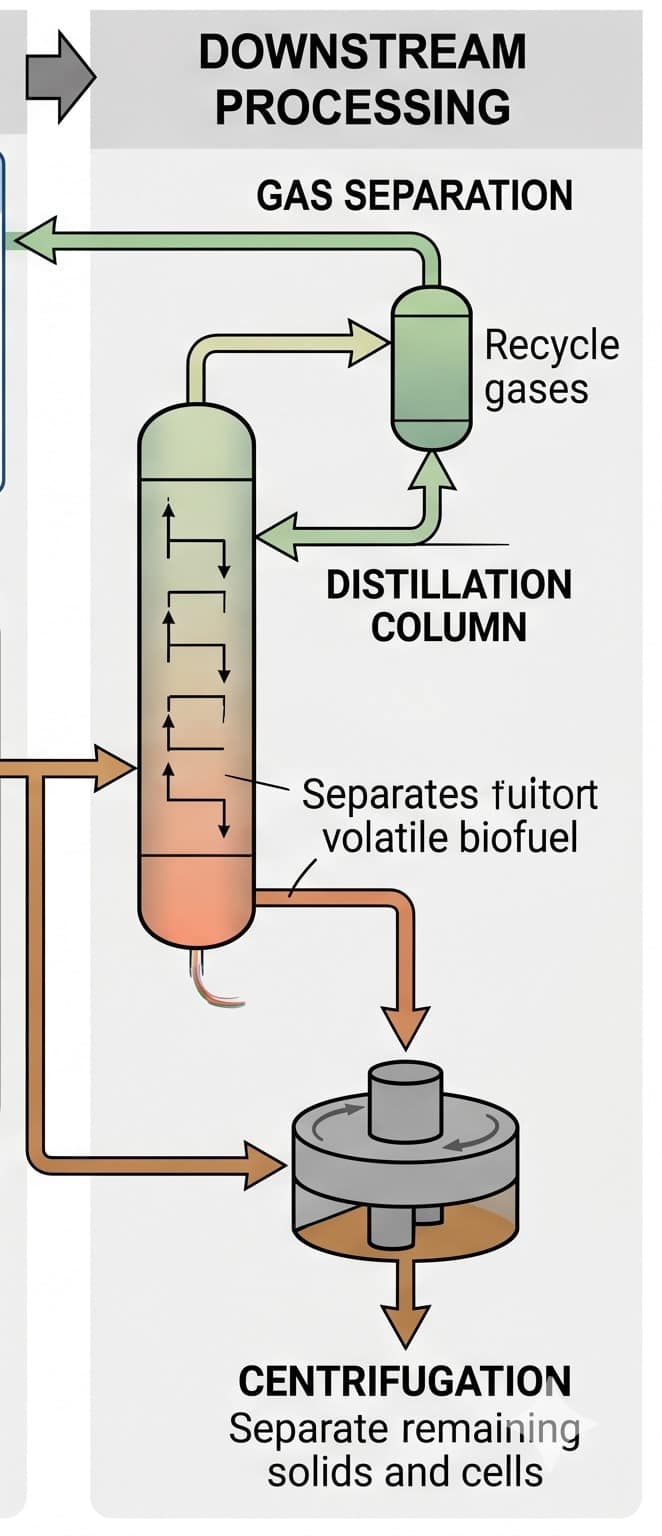
7. Downstream Processing (DSP) & Closed-Loop Gas Recycle
An intensified bioreactor is only as effective as the separation train that harvests its output. As illustrated in Figure 4, downstream processing executes three simultaneous continuous separation stages:
1. Continuous Fractional Distillation
The clarified cell-free permeate stream containing $5\text{–}10\text{ wt\%}$ volatile biofuel (ethanol or butanol) is continuously fed to a multi-stage distillation column with mechanical vapor recompression (MVR):
- The volatile biofuel vaporizes and rises through the column trays, exiting the top condenser as an azeotropic mixture ($95.6\text{ wt\%}$ ethanol).
- Vapor-phase molecular sieve zeolite dehydration beds strip residual moisture, producing anhydrous fuel-grade bioethanol ($>99.5\%$).
- Still bottom vinasse / water is recycled upstream to the hydrolysis wash tanks, closing the water loop.
2. Centrifugation & Solid Residue Dewatering
The small cell bleed stream and unhydrolyzed lignin solids pass through a continuous disk-stack centrifuge or decanter centrifuge. Dewatered biomass cake is dried and routed to an on-site biomass boiler or gasifier, generating process steam and electricity for net-positive facility energy balance.
3. Gas Separation & Closed-Loop Syngas Recycling
In syngas fermentation, single-pass carbon conversion rarely exceeds $70\text{–}80\%$. Venting unreacted $CO$ and $H_2$ to atmosphere would destroy process economics and violate emissions standards. In this intensified architecture:
- Exhaust gases pass through a knock-out drum to capture volatile solvent mist.
- A Pressure Swing Adsorption (PSA) or polymeric gas permeation membrane separates clean $CO_2$ (which can be sequestered or sold for food-grade use) from combustible $CO$ and $H_2$.
- The unreacted $CO$ and $H_2$ are re-compressed and recycled directly back into the CSTR microsparger! Total plant carbon conversion efficiency surges past $95\%$.
8. Quantitative Worked Example: Batch vs. Fed-Batch vs. Intensified Membrane CSTR
To demonstrate the staggering economic and physical advantage of process intensification, consider a commercial bioethanol manufacturing plant operating with a target output of 10,000 metric tons per year:
| Performance Metric | Traditional Batch | Standard Fed-Batch | Intensified Membrane CSTR | Engineering Advantage |
|---|---|---|---|---|
| Steady-State Biomass ($X$) | $4\text{–}6\text{ g/L}$ | $12\text{–}18\text{ g/L}$ | $55\text{–}70\text{ g/L}$ | $4\times$ to $12\times$ biocatalyst density |
| Operating Dilution Rate ($D$) | N/A (Batch) | N/A (Fed-Batch) | $0.40\text{ h}^{-1}$ | Continuous volumetric throughput |
| Volumetric Productivity ($Q_p$) | $1.2\text{ g/L/h}$ | $2.8\text{ g/L/h}$ | $18.5\text{ g/L/h}$ | $6.6\times$ higher space-time yield! |
| Required Working Volume ($V$) | $114,000\text{ L}$ | $49,000\text{ L}$ | $7,400\text{ L}$ | $85\%$ reduction in vessel footprint! |
| Downtime (CIP / SIP / Turnaround) | $25\text{–}30\%$ of total time | $15\text{–}20\%$ of total time | $<3\%$ (Runs for 60+ days) | Continuous asset utilization |
| Estimated Capital Cost (CapEx) | Baseline ($100\%$) | $75\%$ | $38\%$ | Smaller footprint, less steel, smaller skid |
The numbers speak for themselves. By intensifying the process with external membrane cell recycle and continuous syngas/sugar co-feeding, the required bioreactor volume shrinks from over 100,000 liters down to barely 7,400 liters to produce the exact same metric tonnage of biochemical product. Plant CapEx drops by more than $60\%$, and operational energy efficiency increases drastically.
9. Accelerate Your Biorefinery Design with BioFlo Computational Tools
Scaling and intensifying a continuous biorefinery requires rigorous multiphase kinetics, membrane filtration sizing, and mass transfer predictions. Eliminate empirical guesswork with BioFlo’s suite of validated bioprocess calculators:
🚀 Model, Simulate, and Scale Your Bioprocess with BioFlo
Deploy instantaneous, scientifically verified bioprocess web calculators built for chemical and bioprocess engineers:
📐 Bioreactor Scale-Up Engine →
Model geometric similarity, constant P/V, tip speed, and shear across vessels
🌊 kLa Mass Transfer Predictor →
Simulate Van ‘t Riet & multiphase microbubble mass transfer for O2, CO, and H2
⏱️ Mixing Time & Residence Time →
Calculate 95% blend time, CSTR residence time distributions (RTD), and circulation
🔬 Respirometry & Off-Gas Analytics →
Analyze OTR, OUR, CER, RQ, and Henry’s law gas partial pressures in real time
\ Get the latest news /