

⚡ Executive Summary for Upstream MSAT & Bioprocess Engineers
- The Dual Meaning of “P/V Scaling”: In industrial biotechnology, engineers often conflate two distinct phenomena: Power-to-Volume ratio ($P/V$ in W/m³), the workhorse kinetic mixing rule, and Pressure-Volume ($P$-$V$) thermodynamics, the physical reality of liquid height ($\rho g H$) and vessel headspace backpressure across scales. Both govern scale-up success or catastrophic batch failure.
- The Hydrostatic Pressure Gradient: In a 5 L benchtop glass vessel ($H_L \approx 0.25\text{ m}$), hydrostatic pressure is barely $0.025\text{ bar}$ ($2.5\%$). In a 15,000 L production fermenter ($H_L \approx 5.5\text{ m}$), hydrostatic head adds over $0.54\text{ bar}$ ($54\text{ kPa}$) at the bottom sparger. Coupled with a standard $0.30\text{ barg}$ headspace overpressure, total bottom pressure exceeds $1.84\text{ bar (abs)}$—an $82\%$ increase over atmospheric conditions!
- Henry’s Law & Bubble Expansion: Sparge gas entering at $1.84\text{ bar}$ experiences an $82\%$ higher equilibrium oxygen solubility ($C^*_{O_2}$). As bubbles rise toward the surface, pressure drops, causing bubbles to expand in volume by over $41\%$ ($P_1 V_1 = P_2 V_2$), accelerating superficial velocity and bubble coalescence.
- The $p\text{CO}_2$ Accumulation Trap: High hydrostatic pressure suppresses dissolved carbon dioxide ($d\text{CO}_2$) desorption at vessel bottoms. Large-scale mammalian CHO cultures frequently spike above $120\text{–}150\text{ mmHg } p\text{CO}_2$, causing hypercapnic cellular stress, intracellular acidosis, and altered antibody glycan profiles (reduced sialylation).
- The Constant $P/V$ Trade-Off: Scaling at constant $P/V = 1.0\text{ kW/m}^3$ forces impeller tip speed to surge ($v_{\text{tip}} \propto V^{1/9}$), increasing from $1.20\text{ m/s}$ to $2.92\text{ m/s}$ ($+143\%$), while blend time expands ($\theta_{95} \propto V^{2/9}$) from $10\text{ s}$ to nearly $60\text{ s}$.
When bioprocess engineers transition an upstream mammalian cell culture or microbial fermentation from benchtop R&D to commercial production, they encounter a notorious semantic and physical trap: pressure-volume scaling.
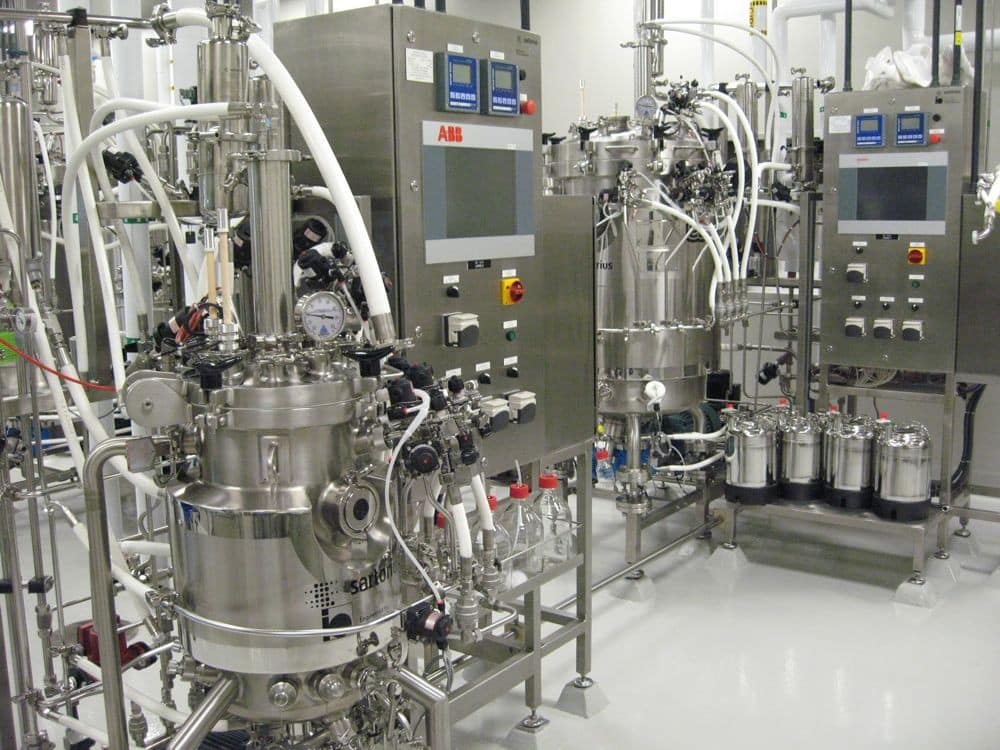
To an agitation specialist, “P/V” means power per unit volume ($P/V$, measured in $\text{W/m}^3$ or $\text{kW/m}^3$)—the primary criterion used to guarantee equivalent turbulent energy dissipation. But to a pilot-plant engineer or MSAT lead standing beside a three-story, 15,000-liter stainless steel fermenter, “P-V” means the relentless thermodynamic reality of pressure and volume: headpressure, hydrostatic liquid columns, gas expansion, and dissolved gas solubility gradients.
In this masterclass, we dissect both dimensions of pressure-volume scaling. We examine the exact physics governing hydrostatic pressure gradients, bubble volume expansion, Henry’s Law solubility shifts, carbon dioxide trapping, and the fundamental trade-offs between tip speed, shear, and blend time when scaling agitated vessels.
1. Demystifying “P/V”: Power per Unit Volume vs. Pressure-Volume Physics
Before writing a single differential mass balance, process development teams must clarify whether their team is addressing hydrodynamic power dissipation or hydrostatic thermodynamic pressure:
⚡ Power-to-Volume Ratio ($P/V$)
Represents the mechanical rate of energy injected into the broth by the agitator motor per unit volume of fluid:
P / V = (Np · ρ · N3 · D5) / V
- Governs volume-averaged turbulent energy dissipation ($\bar{\varepsilon} = P / \rho V$).
- Controls gas dispersion, bubble breakup, and the specific interfacial area ($a$).
- Directly impacts oxygen mass transfer coefficient ($k_L a \propto (P/V)^\alpha \cdot v_s^\beta$).
🌡️ Pressure-Volume Dynamics ($P$-$V$)
Represents the physical, hydrostatic, and headspace pressure exerted across the liquid column volume:
P(z) = Pheadspace + ρ · g · (HL − z)
- Establishes an axial pressure gradient from vessel surface to bottom sparger.
- Governs local gas equilibrium solubility via Henry’s Law ($C^* = y_i P_{\text{tot}} / H_e$).
- Drives bubble expansion, gas residence times, and CO2 stripping efficiency.
2. The Pressure Gradient Dilemma: Hydrostatic Head ($\rho g H$) Across Scale
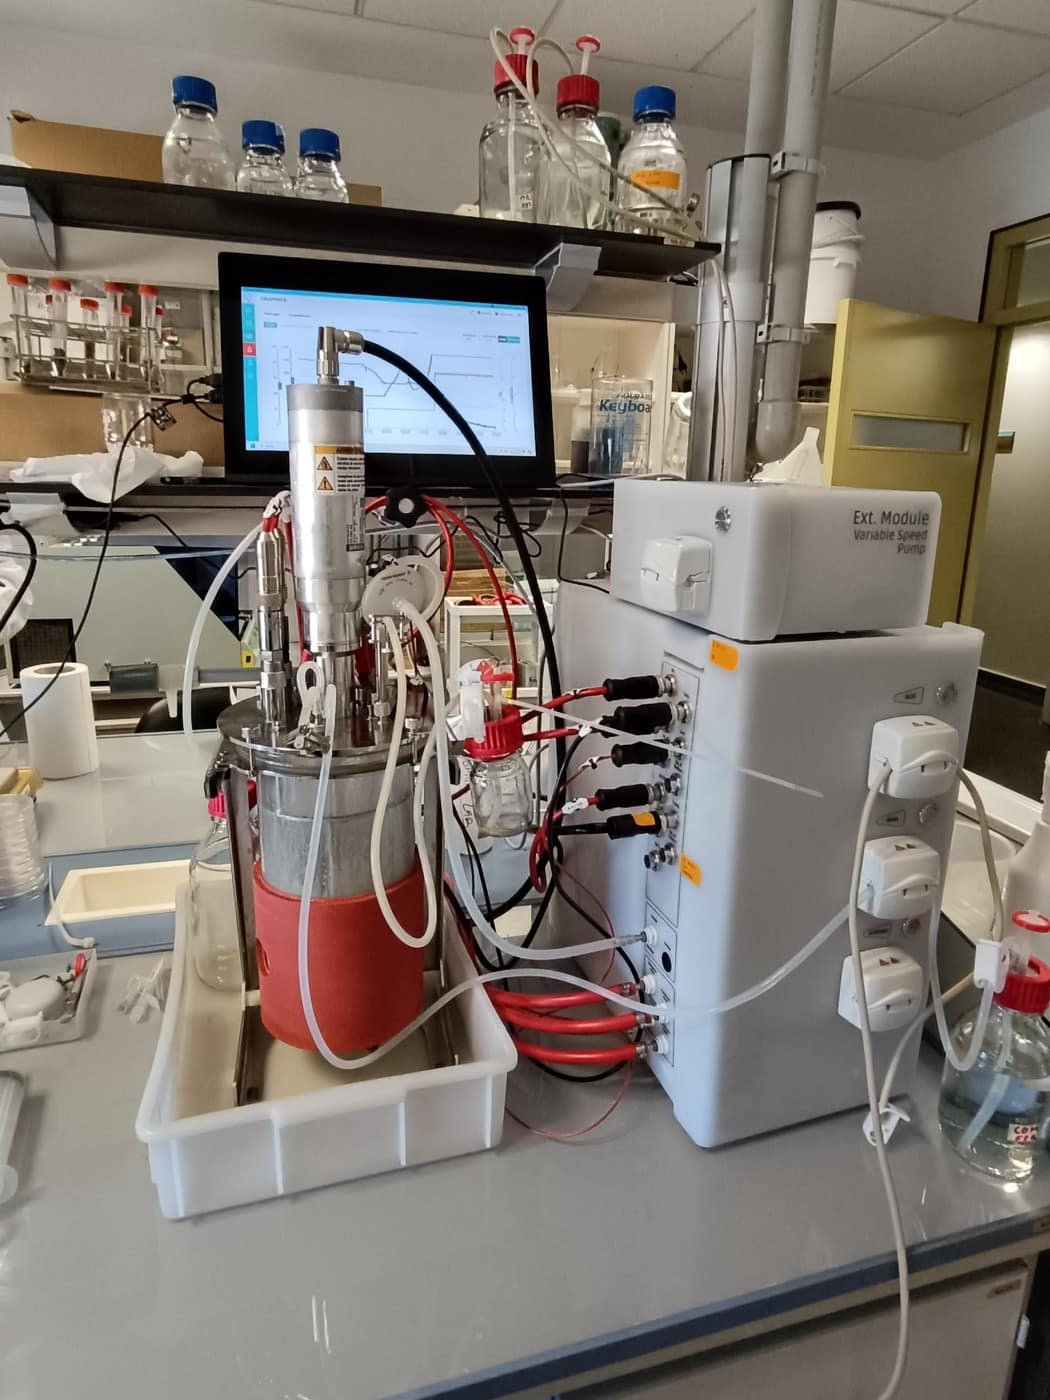
In small benchtop vessels (1 L to 5 L), the broth depth rarely exceeds 25 cm. The hydrostatic pressure contribution at the bottom sparger is:
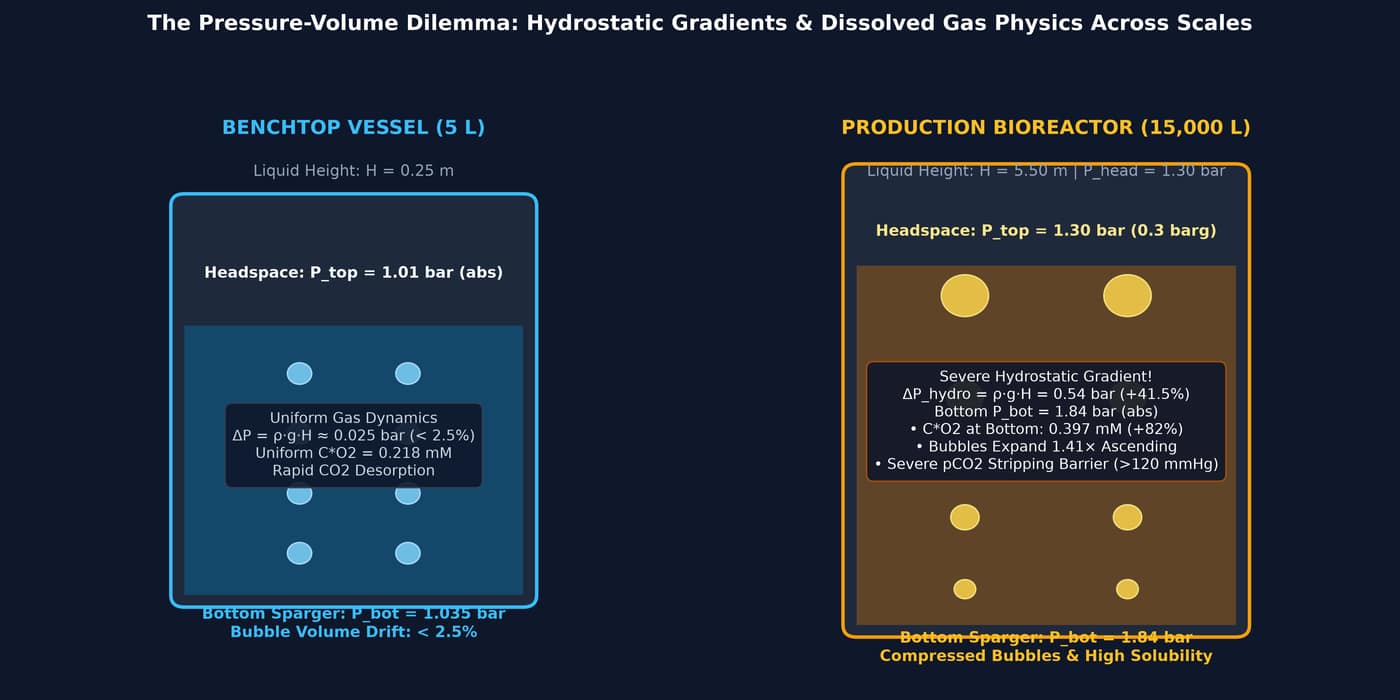
$\Delta P_{\text{hydro}} = \rho \cdot g \cdot H_L = (1000\text{ kg/m}^3)(9.81\text{ m/s}^2)(0.25\text{ m}) = 2,452.5\text{ Pa} \approx 0.0245\text{ bar}$
Because ambient pressure is roughly $1.013\text{ bar}$, this $0.025\text{ bar}$ hydrostatic head represents a negligible $2.4\%$ variation between the bottom and surface of the liquid. In benchtop reactors, total pressure is effectively constant throughout the entire volume.
Now consider what happens in a commercial 15,000 L production bioreactor with a working broth depth $H_L = 5.50\text{ m}$:
$\Delta P_{\text{hydro}} = (1000\text{ kg/m}^3)(9.81\text{ m/s}^2)(5.50\text{ m}) = 53,955\text{ Pa} \approx 0.540\text{ bar}$
Furthermore, commercial stainless steel vessels are virtually never operated at atmospheric headspace pressure. To maintain vessel sterility, prevent bioburden ingress during sampling, and provide positive pressure driving force through sterile exhaust filter housings, biomanufacturers maintain a regulated headspace backpressure of $0.20\text{ to }0.40\text{ barg}$ ($1.20\text{ to }1.40\text{ bar absolute}$).
Bottom Sparger Absolute Pressure Calculation (15,000 L):
Pbottom = Pheadspace + ΔPhydro = 1.30 bar + 0.54 bar = 1.84 bar (abs)
The cells swimming near the bottom sparger live at $1.84\text{ bar absolute}$ ($184\text{ kPa}$), while cells near the broth surface reside at $1.30\text{ bar absolute}$. This represents a massive $41.5\%$ pressure differential inside the exact same vessel!
3. Bubble Thermodynamics: Boyle’s Law, Expansion Work, and Gas Hold-Up Drift
Gases are compressible fluids. When sparging air or pure oxygen into a deep bioreactor, the sparged bubble does not maintain a fixed physical geometry as it rises toward the liquid surface.
Volumetric Expansion of Rising Bubbles
Assuming isothermal expansion at culture temperature ($37^\circ\text{C}$ / $310.15\text{ K}$), the volume of a rising gas bubble is governed by Boyle’s Law:
$P_{\text{bottom}} \cdot V_{\text{bubble, bottom}} = P_{\text{surface}} \cdot V_{\text{bubble, surface}}$
For our 15,000 L vessel:
$\frac{V_{\text{bubble, surface}}}{V_{\text{bubble, bottom}}} = \frac{P_{\text{bottom}}}{P_{\text{surface}}} = \frac{1.84\text{ bar}}{1.30\text{ bar}} = \mathbf{1.415}$
As the bubble ascends through the 5.5-meter broth column, its volume expands by $41.5\%$! This expansion has severe hydrodynamic consequences:
- Bubble Diameter Growth: Because volume scales with diameter cubed ($V \propto d_b^3$), bubble diameter increases by $d_{\text{surface}} / d_{\text{bottom}} = (1.415)^{1/3} = \mathbf{1.123}$ ($+12.3\%$).
- Accelerating Rise Velocity ($u_b$): Larger bubbles experience greater buoyant forces ($F_b = \Delta \rho \cdot V_b \cdot g$). Rise velocity increases, reducing the gas-liquid contact residence time in the upper third of the vessel.
- Diminishing Specific Interfacial Area ($a$): Specific surface area per unit volume of gas is $a = 6 / d_b$. As bubbles swell, their surface area-to-volume ratio decreases, reducing the local oxygen transfer efficiency ($k_L a$) near the top of the vessel.
- Local Superficial Gas Velocity Drift ($v_s$): Gas volumetric flow rate expands continuously from the sparger to the broth surface, causing superficial gas velocity ($v_s = Q / A_{\text{tank}}$) to accelerate as it nears the surface, increasing the propensity for surface foam generation and entrainment.
4. The Constant $P/V$ Scale-Up Paradox: Tip Speed Drift vs. Mixing Time Explosion
Let us now pivot to the agitation side of pressure-volume scaling: Power per unit volume ($P/V$). For decades, maintaining a constant $P/V$ ratio has been taught as the golden rule of bioprocess scale-up. But what actually happens mathematically when you enforce constant $P/V$ across four orders of magnitude?
In the fully turbulent regime (Impeller Reynolds Number $Re = \rho N D^2 / \mu > 10^4$), the ungassed power draw is:
$P = N_p \cdot \rho \cdot N^3 \cdot D^5$
Assuming geometric similarity, vessel volume scales with impeller diameter cubed ($V \propto D^3$). Therefore, power per unit volume scales as:
$\frac{P}{V} \propto \frac{N^3 D^5}{D^3} \propto N^3 D^2 = \text{constant}$
From this simple relation, we derive the fundamental scaling exponents for rotational speed, tip speed, and mixing time:
Scaling Exponents at Constant $P/V$:
- Agitator Speed ($N$): $N \propto D^{-2/3} \propto V^{-2/9}$ → Decreases with scale.
- Impeller Tip Speed ($v_{\text{tip}} = \pi N D$): $v_{\text{tip}} \propto D \cdot D^{-2/3} = D^{1/3} \propto \mathbf{V^{1/9}}$ → Increases with scale!
- 95% Blend / Mixing Time ($\theta_{95}$): In turbulent stirred tanks, dimensionless mixing time $N \cdot \theta_{95} \approx \text{const}$. Therefore, $\theta_{95} \propto 1/N \propto \mathbf{V^{2/9}}$ → Explodes with scale!
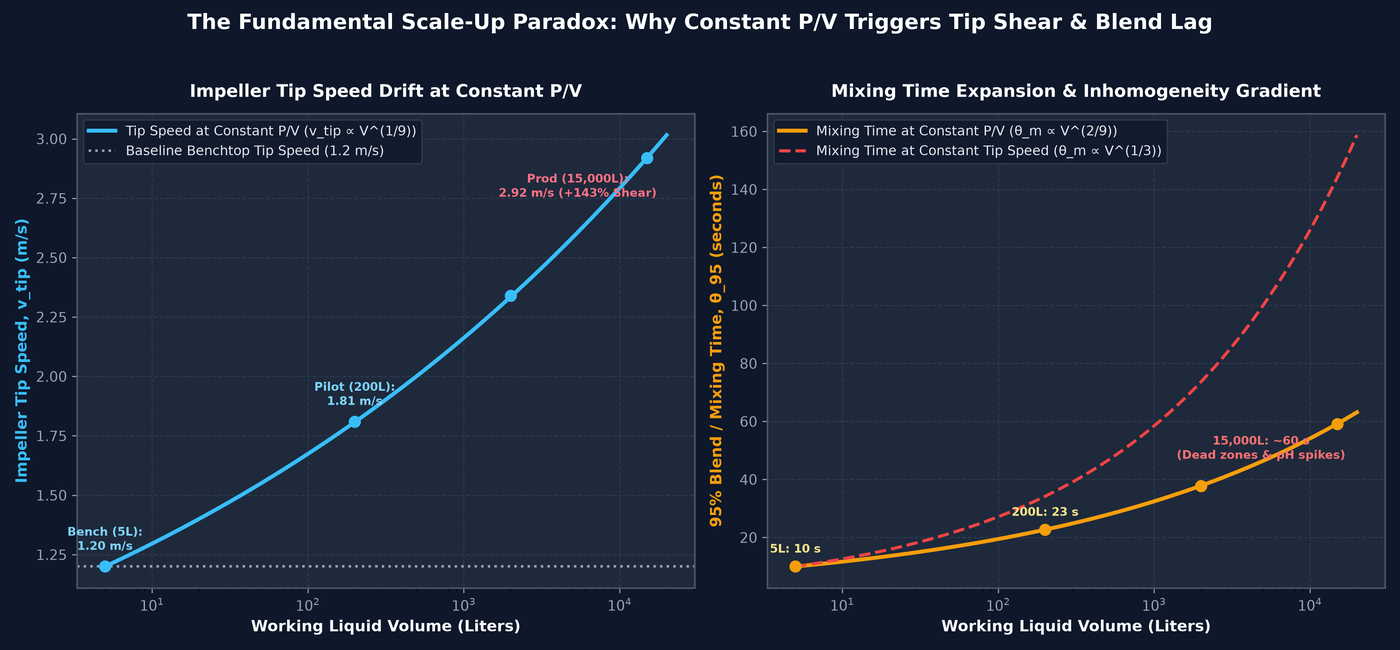
The Shear vs. Mixing Catch-22
Notice the impossible physical conflict exposed in Figure 5:
- If you hold constant $P/V$ to preserve the average oxygen transfer coefficient ($k_L a$), your impeller tip speed rises from $1.20\text{ m/s}$ to $2.92\text{ m/s}$. The maximum local shear rate ($\gamma_{\text{max}} \approx 100 \cdot N$) at the blade tips intensifies, creating zones of extreme Kolmogorov microscale dissipation ($\varepsilon_{\text{max}} \approx 10\text{–}30 \times \bar{\varepsilon}$) that can shear microcarriers, damage shear-sensitive cell lines, or trigger cell lysis.
- If you instead scale on constant tip speed ($v_{\text{tip}} = \text{const}$) to safeguard cell viability, power per unit volume plummets: $P/V \propto D^{-1} \propto V^{-1/3}$. At 15,000 L, $P/V$ drops by over $90\%$ down to $0.07\text{ kW/m}^3$! Your oxygen transfer rate ($k_L a$) collapses, suffocating the culture mid-exponential phase.
- Meanwhile, mixing time increases 6-fold (from $10\text{ s}$ to $\approx 60\text{ s}$). When automated pH controllers pump concentrated $1\text{ M NaOH}$ or $2\text{ M Na}_2\text{CO}_3$ into the top surface of a 15,000 L vessel with a 60-second blend time, cells near the feed inlet circulate through localized alkaline toxic plumes ($\text{pH} > 8.5$) for dozens of seconds before the base is neutralized.
5. Henry’s Law, Oxygen Supersaturation, and the $p\text{CO}_2$ Accumulation Trap
Now let us connect hydrostatic pressure back to cellular biology. The equilibrium concentration of any dissolved gas in the culture broth is determined by Henry’s Law:
$C^*_i = \frac{p_i}{H_i} = \frac{y_i \cdot P_{\text{total}}(z)}{H_i}$
Where $y_i$ is the mole fraction of gas $i$, $P_{\text{total}}(z)$ is the total pressure at height $z$, and $H_i$ is Henry’s constant for the broth at $37^\circ\text{C}$ ($H_{O_2} \approx 4.65 \times 10^4\text{ bar}\cdot\text{L/mol}$; $H_{CO_2} \approx 1.63 \times 10^3\text{ bar}\cdot\text{L/mol}$).
1. Oxygen Supersaturation at the Bottom
At the sparger of our 15,000 L vessel ($P_{\text{total}} = 1.84\text{ bar}$), air with $21\% \text{ O}_2$ yields an equilibrium dissolved oxygen saturation:
$C^*_{O_2, \text{bottom}} = \frac{0.21 \times 1.84\text{ bar}}{H_{O_2}} = 0.397\text{ mM} \quad (+82\%\text{ compared to 1 atm benchtop!})$
This provides a massive initial driving force for oxygen transfer ($\text{OTR} = k_L a (C^* – C_L)$). Cells passing through the lower impeller zone experience high dissolved oxygen tension.
2. The Carbon Dioxide Trapping Crisis ($p\text{CO}_2$ Accumulation)
While elevated pressure helps push oxygen into the liquid, it acts as a severe barrier to pulling carbon dioxide out of the liquid. In mammalian cell culture (e.g., CHO, HEK293), cells produce metabolic CO2 via cellular respiration at a Respiratory Quotient ($\text{RQ} = \text{CER} / \text{OUR}$) typically between $0.85\text{ and }1.05$.
CO2 desorption driving force is:
$\text{CTR} = k_L a_{\text{CO}_2} \cdot \left( C_{L, \text{CO}_2} – C^*_{\text{CO}_2} \right)$
Where $C^*_{\text{CO}_2} = y_{\text{CO}_2} \cdot P_{\text{total}} / H_{\text{CO}_2}$. When $P_{\text{total}}$ is elevated by $0.54\text{ bar}$ of hydrostatic head and $0.30\text{ bar}$ of headspace overpressure, $C^*_{\text{CO}_2}$ is significantly higher. The concentration gradient driving CO2 out of the liquid and into the sparged bubbles is sharply reduced!
⚠️ The Biological Cost of Hypercapnia in Commercial CHO Bioreactors:
- Optimal $p\text{CO}_2$ Range: $40\text{ to }70\text{ mmHg}$ ($5\text{–}9\%$).
- Mild Hypercapnia: $80\text{ to }120\text{ mmHg}$ → Reduced specific growth rate, increased osmolality from base addition.
- Severe Hypercapnia: $>140\text{ to }180\text{ mmHg}$ → Intracellular acidosis, suppressed lactate consumption, and impaired therapeutic protein glycosylation (up to $30\text{–}50\%$ drop in terminal sialylation, drastically reducing antibody serum half-life).
At bench scale, carbon dioxide strips effortlessly through the shallow liquid depth. At 15,000 L, the combination of hydrostatic pressure and reduced volumetric gas flow ($vvm$ throttled down to prevent foaming) traps CO2 in the broth. This is why many processes that ran flawlessly in 5 L bench glass experience massive product quality failures when scaled to 15,000 L!
6. Industrial Worked Example: Scaling 5 L Benchtop to 15,000 L Production
To see how these principles interact in practical engineering, let us perform a complete, quantitative scale-up calculation for a commercial CHO fed-batch monoclonal antibody (mAb) process:
| Parameter | 5 L Benchtop (Scale 1) | 15,000 L Production (Scale 2) | Engineering Governing Rule |
|---|---|---|---|
| Working Volume ($V$) | $0.005\text{ m}^3$ (5 L) | $15.0\text{ m}^3$ (15,000 L) | Volumetric scale factor: $S = 3,000\times$ |
| Tank Diameter ($T$) | $0.160\text{ m}$ | $2.30\text{ m}$ | Geometric similarity ($T \propto V^{1/3}$) |
| Liquid Height ($H_L$) | $0.250\text{ m}$ | $5.50\text{ m}$ | Aspect ratio $H_L / T \approx 2.4:1$ |
| Hydrostatic Head ($\Delta P_{\text{hydro}}$) | $0.0245\text{ bar}$ | $0.540\text{ bar}$ | $\Delta P = \rho \cdot g \cdot H_L$ |
| Headspace Pressure ($P_{\text{head}}$) | $1.013\text{ bar (abs)}$ | $1.300\text{ bar (abs)}$ ($0.3\text{ barg}$) | Sanitary overpressure regulation |
| Bottom Sparger Pressure ($P_{\text{bot}}$) | $1.038\text{ bar (abs)}$ | $1.840\text{ bar (abs)}$ | $P_{\text{bot}} = P_{\text{head}} + \Delta P_{\text{hydro}}$ ($+77.3\%$ vs bench) |
| Power / Unit Volume ($P/V$) | $1.00\text{ kW/m}^3$ | $1.00\text{ kW/m}^3$ | Held constant as baseline criterion |
| Agitator Speed ($N$) | $350\text{ rpm}$ ($5.83\text{ s}^{-1}$) | $58.5\text{ rpm}$ ($0.975\text{ s}^{-1}$) | $N_2 = N_1 \cdot (V_1 / V_2)^{2/9} = N_1 \cdot (3000)^{-0.222}$ |
| Impeller Tip Speed ($v_{\text{tip}}$) | $1.20\text{ m/s}$ | $2.92\text{ m/s}$ | $v_{\text{tip}} \propto V^{1/9}$ ($+143\%$ shear elevation) |
| 95% Blend / Mixing Time ($\theta_{95}$) | $9.8\text{ s}$ | $58.6\text{ s}$ | $\theta_{95} \propto V^{2/9}$ ($6\times$ blend sluggishness) |
| Bubble Volume Expansion | $1.02\times$ ($+2.4\%$) | $1.415\times$ ($+41.5\%$) | Boyle’s Law: $P_{\text{bot}} / P_{\text{head}}$ |
7. The Modern Multi-Criterion Scale-Up Framework: How to Win
Faced with these coupled hydrodynamic and hydrostatic constraints, modern bioprocess development teams abandon single-variable scale-up rules in favor of a decoupled, multi-criterion regime:
1. Decouple OTR and CO2 Stripping via Dual-Sparging
Never rely on a single sparger to simultaneously provide oxygen mass transfer and carbon dioxide stripping at 15,000 L. Implement a dual-sparging architecture:
- Microsparger / Sintered Frit with Pure O2: Generates fine bubbles ($0.5\text{–}1.5\text{ mm}$) with high interfacial area ($a$), meeting peak cellular oxygen uptake rate ($\text{OUR}$) with minimal volumetric gas flow.
- Open Drilled-Pipe Macrosparger with Air / N2: Generates large bubbles ($4\text{–}8\text{ mm}$) with short residence times. Large bubbles rise quickly, creating a low-shear gas convective current that strips volatile dissolved CO2 out of the liquid phase without creating runaway foaming or excessive surface cell bursting.
2. Modulate Headspace Overpressure Dynamic Scheduling
Rather than maintaining a constant headpressure throughout the 14-day fed-batch culture:
- Early Exponential Phase (Days 0–5): Operate at higher backpressure ($0.30\text{–}0.40\text{ barg}$) to maximize early oxygen driving force without needing high impeller speeds or pure oxygen enrichment.
- Late Stationary / Peak Titre Phase (Days 6–14): As cell density peaks and $d\text{CO}_2$ accumulates above $90\text{ mmHg}$, reduce headspace overpressure to $0.10\text{–}0.15\text{ barg}$. Lowering total pressure immediately enhances the desorption driving force for carbon dioxide, keeping $p\text{CO}_2$ safely below the $120\text{ mmHg}$ hypercapnic toxicity threshold.
3. Hybrid Impeller Geometry (P/V & Tip Speed Compromise)
Replace traditional radial Rushton turbines with axial hydrofoil impellers (e.g., Lightnin A310, pitched-blade turbines). High-solidity hydrofoils deliver superior bulk liquid blending and axial pumping at lower power numbers ($N_p \approx 0.3\text{–}0.8$ vs. $N_p \approx 4.5\text{–}5.5$ for Rushtons). This allows operators to maintain bulk fluid turnover ($\theta_{95} < 35\text{ s}$) while keeping maximum tip speeds safely below $2.5\text{ m/s}$.
8. Scale-Up Summary & Recommended BioFlo Calculators
When designing, scaling, or troubleshooting a stirred-tank fermentation or cell culture process, remember these three core pressure-volume rules:
- Never scale on volumetric flow rate (vvm) or power-to-volume ($P/V$) alone. Always quantify the accompanying drift in impeller tip speed ($v_{\text{tip}}$), Kolmogorov microscale ($\eta$), and 95% blend time ($\theta_{95}$).
- Account for hydrostatic pressure ($\rho g H$) in every dissolved gas mass balance. Calculate the logarithmic mean pressure across the vessel height to accurately predict dissolved oxygen saturation ($C^*_{O_2}$) and carbon dioxide desorption rates.
- Use headspace overpressure as an active process control knob. Modulate backpressure to balance oxygen delivery during peak respiration against CO2 stripping during stationary phase.
🚀 Accelerate Your Upstream Development with BioFlo Apps
Eliminate spreadsheet errors, rule-of-thumb guesswork, and unexpected scale-up yield losses. BioFlo provides instant, scientifically verified computational bioprocess tools:
📐 Bioreactor Scale-Up Engine →
Scale by constant P/V, tip speed, or kLa across any vessel geometry
🌊 kLa Mass Transfer Predictor →
Predict Van ‘t Riet & multiphase bubble dynamics under pressure
⏱️ Mixing Time Calculator →
Estimate 95% blend time & fluid circulation times across scales
🔬 OTR & OUR Respirometry →
Calculate cell-specific respiration, CER, RQ, and Henry’s law dynamics
\ Get the latest news /