

⚡ Executive Summary for Downstream Bioprocess Leads & MSAT Engineers
- The Batch Capacity Bottleneck: Conventional single-column capture halts loading at 1% to 5% breakthrough ($DBC_{1\%}$), leaving 40% to 50% of costly Protein A resin capacity unutilized and requiring massive column diameters ($D_c \ge 40\text{–}60\text{ cm}$).
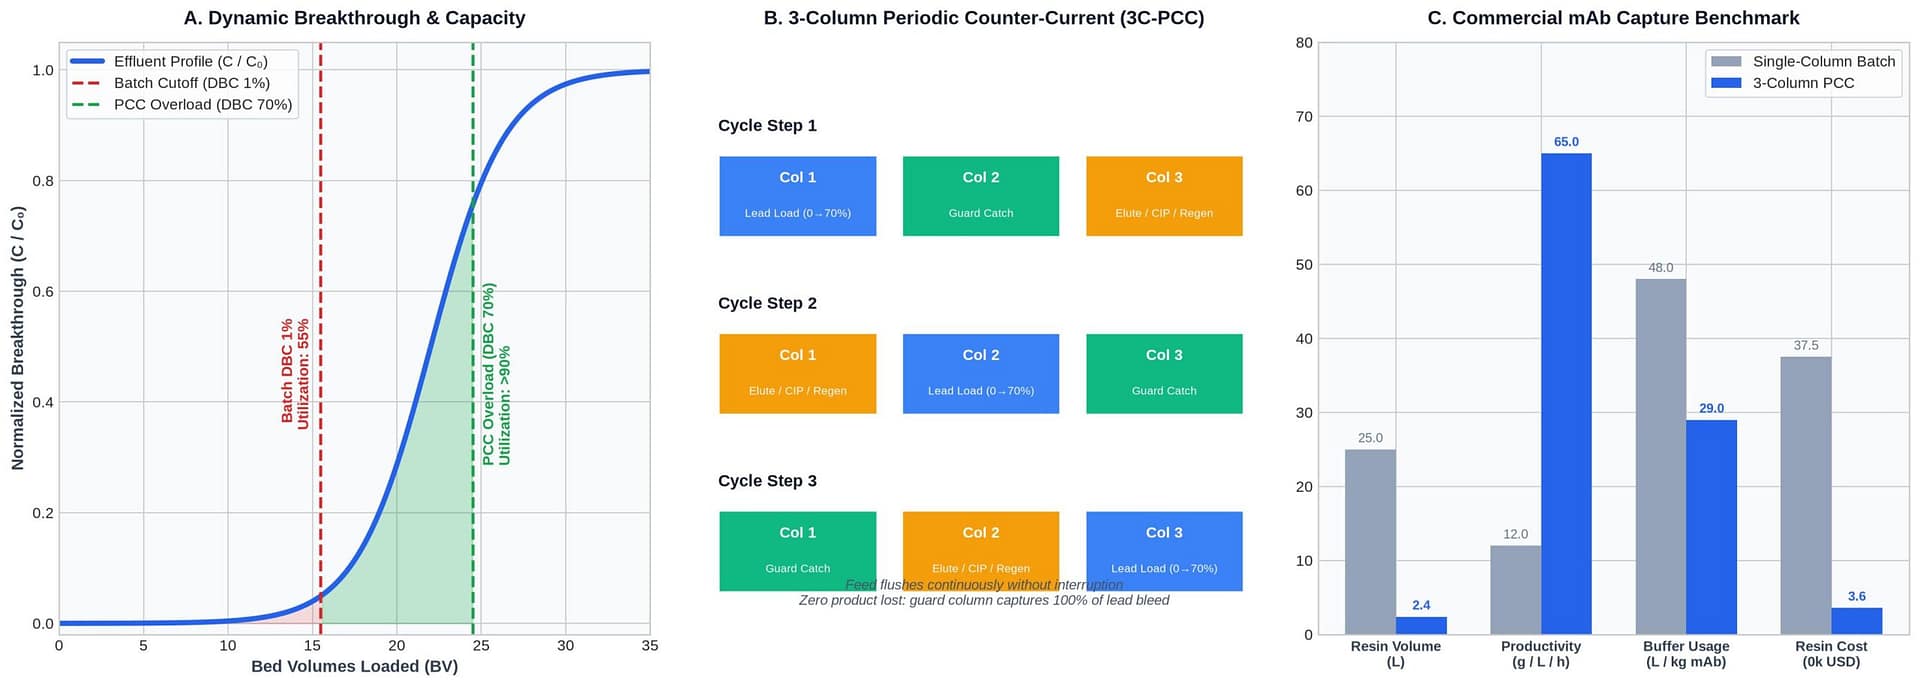
- The Multi-Column Counter-Current Paradigm: Connecting 3 to 4 smaller columns in series allows the lead column to be overloaded to 70%–85% breakthrough ($DBC_{70\%}$), while the secondary guard column captures 100% of the leaked product.
- Resin Utilization & Capex Reduction: Resin capacity utilization increases from $\approx 55\%$ in batch mode to $>90\%$ in Periodic Counter-Current Chromatography (PCC), slashing Protein A resin inventory by 75% to 85% (from 25 L down to under 3 L for a 2,000 L harvest).
- Buffer & Footprint Savings: Process intensification reduces buffer consumption by 25% to 40% and allows downstream skids to fit inside modular ballroom cleanroom suites.
- Automated PAT Peak-Cutting: In-line UV ($A_{280}/A_{300}$) and conductivity sensors trigger dynamic column switching regardless of feed titer variability or resin fouling.
💡 Continuous Chromatography for Purification Overview
Implementing continuous chromatography for purification of monoclonal antibodies and recombinant proteins eliminates the traditional downstream batch bottleneck. By operating multi-column counter-current systems (such as 3C-PCC and SMB), biomanufacturers increase resin capacity utilization from 50% to >85%, decrease Protein A resin requirements by up to 70%, and shrink column footprints for continuous biomanufacturing.
1. The Downstream Dilemma: Why Batch Protein A Capture Stifles Bioprocess Scale
Over the past two decades, upstream bioreactor titers for monoclonal antibodies (mAbs) and recombinant proteins have surged from $0.5\text{ g/L}$ to well over $5.0\text{–}10.0\text{ g/L}$ via intensified fed-batch and perfusion cultures. Yet downstream bioprocessing continues to rely primarily on single-column batch chromatography skids designed in the 1990s.
In single-column batch chromatography, product loading must be terminated strictly before the front edge of the mass transfer zone (MTZ) exits the column bed—typically at 1% or 5% breakthrough ($DBC_{1\%}$ or $DBC_{5\%}$). Loading beyond this point leads to irreversible yield loss in the flow-through waste stream. Because the mass transfer zone across a porous resin bed is wide and dispersed by pore diffusion resistance, up to 45% of the resin equilibrium binding capacity ($Q_{\max}$) remains completely empty at the end of each load cycle.
For high-cost affinity ligands like alkali-stabilized recombinant Protein A (costing between $12,000 and$18,000 per liter), this unutilized capacity represents massive idle capital expenditure. Furthermore, to process a 2,000 L harvest within a reasonable working shift, batch chromatography demands large column diameters ($40\text{–}60\text{ cm}$ ID), deep resin beds ($20\text{ cm}$), and gargantuan buffer holding tanks ($1,500\text{–}3,000\text{ L}$) that dominate biomanufacturing floor space.
2. Governing Transport Phenomena: Modeling Dynamic Breakthrough Curves
To design and optimize continuous chromatography systems, bioprocess engineers rely on mathematical transport equations describing solute adsorption and axial dispersion through packed porous beds. The dynamic breakthrough curve is governed by convective fluid transport, intraparticle pore diffusion, and adsorption kinetics.
The Thomas Model for Breakthrough Prediction
Assuming second-order reversible Langmuir adsorption kinetics with negligible axial dispersion, the classic Thomas Model predicts the effluent concentration profile $C(t)$ over loading time $t$:
$$\frac{C(t)}{C_0} = \frac{1}{1 + \exp\left( \frac{k_{\text{Th}} \cdot q_0 \cdot m_{\text{resin}}}{Q} - k_{\text{Th}} \cdot C_0 \cdot t \right)}$$
Where:
- $C_0$ is the inlet feed antibody concentration ($\text{mg/mL}$ or $\text{g/L}$).
- $C(t)$ is the instantaneous effluent concentration at time $t$.
- $k_{\text{Th}}$ is the Thomas kinetic rate constant ($\text{mL} \cdot \text{mg}^{-1} \cdot \text{min}^{-1}$).
- $q_0$ is the equilibrium static binding capacity of the resin ($\text{mg} \cdot \text{mL}_{\text{resin}}^{-1}$).
- $m_{\text{resin}}$ is the total packed resin mass or volume ($V_c$).
- $Q$ is the volumetric feed flow rate ($\text{mL/min}$).
Dynamic Binding Capacity ($DBC_{x\%}$) Derivation
The Dynamic Binding Capacity at $x\%$ breakthrough ($DBC_{x\%}$) quantifies the mass of target protein bound per unit volume of packed resin bed when the effluent concentration reaches $x\%$ of feed concentration:
$$DBC_{x\%} = \frac{C_0}{V_{\text{column}}} \int_{0}^{V_{\text{load}, x\%}} \left(1 - \frac{C(V)}{C_0}\right) dV \approx \frac{C_0 \cdot (V_{\text{load}, x\%} - V_0)}{V_{\text{column}}}$$
In conventional batch chromatography, operations halt at $V_{\text{load}, 1\%}$, where $C/C_0 = 0.01$. At this instant:
$$\eta_{\text{resin, batch}} = \frac{DBC_{1\%}}{q_0} \times 100\% \approx 50\%\text{ – }60\%$$
In a multi-column counter-current process (e.g., 3C-PCC), the primary column is loaded far past the breakthrough threshold to $C/C_0 = 0.70\text{–}0.85$ ($DBC_{70\%}$), because all leaked product is captured quantitatively by Column 2. As a result, the resin capacity utilization surges:
$$\eta_{\text{resin, PCC}} = \frac{DBC_{70\%}}{q_0} \times 100\% \ge 88\%\text{ – }95\%$$
3. Multi-Column Architectures: 3C-PCC vs. 4C-Simulated Moving Bed (SMB)
Continuous chromatography for biotherapeutics is implemented through two primary engineering architectures: Periodic Counter-Current (PCC) and Simulated Moving Bed (SMB).
A. 3-Column Periodic Counter-Current (3C-PCC)
In a 3C-PCC system, three identical small columns rotate through functional states:
- Interconnected Load State: Clarified feed broth enters Column 1 (Lead). Column 1 is loaded aggressively until its effluent reaches $70\%$ breakthrough. The effluent flows directly into the inlet of Column 2 (Guard/Catch), ensuring zero product loss. Meanwhile, Column 3 undergoes non-loading steps: Wash 1, Wash 2, Elution, CIP (cleaning-in-place), and Re-equilibration.
- First Switch: Once Column 1 hits the breakthrough setpoint, feed switches directly to Column 2 (now the Lead column). Column 1 is taken off-line for washing and elution. Freshly regenerated Column 3 becomes the new Guard column receiving the effluent of Column 2.
- Cyclic Rotation: This sequence repeats continuously, providing uninterrupted feed processing without requiring intermediate surge tanks.
B. Simulated Moving Bed (SMB / BioSMB)
While classic chemical SMB utilizes 8 to 24 columns for continuous binary separation (e.g., fructose/glucose or chiral enantiomers), bioprocess BioSMB platforms employ 4 to 8 columns with multi-position valve manifolds. BioSMB simulates the physical counter-current flow of solid resin against liquid mobile phase by periodically advancing port positions in the direction of fluid flow.
| Architecture | Column Count | Valve & Skid Complexity | Resin Utilization | Best Fit Application |
|---|---|---|---|---|
| Single-Column Batch | 1 large column | Low (Standard 4–6 valve manifold) | 50% – 60% | Early-phase clinical batches or low-volume orphan drugs |
| 3-Column PCC (3C-PCC) | 3 compact columns | Moderate (Multi-channel rotary/pinch valves) | 88% – 93% | Commercial mAb capture from perfusion or high-titer fed-batch |
| 4–8 Column BioSMB | 4 to 8 small columns | High (Integrated diaphragm valve cassettes) | 92% – 96% | End-to-end continuous closed processing & polishing trains |
4. Commercial Engineering Case Study: Sizing mAb Protein A Capture for a 2,000 L Harvest
To quantify the direct economic and operational impact of process intensification, consider a commercial manufacturing facility processing a 2,000 L fed-batch bioreactor harvest with an IgG titer of $3.0\text{ g/L}$ (total product mass: $6.0\text{ kg mAb}$).
Design Basis & Kinetic Assumptions
- Resin Type: High-capacity agarose Protein A resin ($Q_{\max} = 65\text{ mg/mL}$).
- Batch Operating DBC ($DBC_{1\%}$): $35.0\text{ g/L}_{\text{resin}}$ at 4 min residence time.
- PCC Overload DBC ($DBC_{70\%}$): $58.0\text{ g/L}_{\text{resin}}$ at 2 min residence time.
- Resin Unit Cost: $15,000 / L.
- Maximum allowable cycle time for harvest: 12 hours.
| Engineering Metric | Conventional Batch Single-Column | Intensified 3-Column PCC | Intensification Benefit |
|---|---|---|---|
| Column Dimensions | 1 column: 40 cm ID × 20 cm bed height | 3 columns: 10 cm ID × 10 cm bed height | 4× reduction in column diameter |
| Total Packed Resin Volume | 25.1 Liters | 2.36 Liters (3 × 0.785 L) | 90.6% Resin Volume Reduction |
| Initial Protein A Resin Cost | $376,500 | $35,400 | Savings: $341,100 per campaign |
| Specific Resin Productivity | 12.8 g mAb / (L_resin · h) | 68.4 g mAb / (L_resin · h) | 5.3× Higher Productivity |
| Total Buffer Consumption | 1,450 Liters | 920 Liters | 36.5% Buffer Savings |
| Skid Footprint & Tankage | 18 m² (Large skid + 5 × 500 L tanks) | 4.5 m² (Benchtop PCC skid + surge bags) | 75% Cleanroom Footprint Shrinkage |
5. Process Analytical Technology (PAT), Valve Hydraulics & Bioburden Control
Operating continuous chromatography in GMP biomanufacturing introduces specific hardware and operational constraints that differ from traditional batch runs:
Dynamic UV Peak-Cutting & Breakthrough Triggering
Fixed-time switching schemes fail when upstream feed titers fluctuate between batches. Advanced continuous skids integrate Process Analytical Technology (PAT) using dual-wavelength in-line UV sensors ($280\text{ nm}$ and $300\text{ nm}$ for high-concentration linearity):
$$\Delta A(t) = \frac{A_{\text{effluent}}(t) - A_{\text{baseline}}}{A_{\text{feed}} - A_{\text{baseline}}}$$
When $\Delta A(t)$ crosses the validated breakthrough threshold (e.g., $70\%$), the automated PLC triggers the multi-port valve switch instantaneously, guaranteeing consistent column loading regardless of feed titer variance.
Bioburden Mitigation & Valve Manifold Dead-Legs
- Dead-Leg Elimination: Traditional stainless steel tubing manifolds create stagnant pockets where bacteria can colonize during multi-day continuous runs. Modern continuous skids utilize single-use injection-molded block manifolds or low-shear rotary valves where flow paths are flushed completely during sanitization cycles.
- Continuous Low-pH Viral Inactivation: Continuous capture effluent is directed into continuous plug flow reactors (PFR) or alternating holding surge vessels maintained at $\text{pH } 3.5\text{–}3.8$ for 30–60 minutes before immediate continuous neutralization.
- CIP Cycling: Because columns cycle 15 to 30 times per batch instead of 3 to 5 times, caustic contact time must be balanced to prevent premature Protein A ligand deamidation. Alternating between $0.1\text{ M NaOH}$ and $20\%\text{ ethanol}$ sanitization ensures bioburden sterility while maintaining ligand longevity over $>150$ cycles.
🚀 Model Your Chromatography Columns with BioFlo Tools
Optimize your downstream bioprocess scaling parameters, dynamic binding capacity, and residence times using our free interactive web calculators: